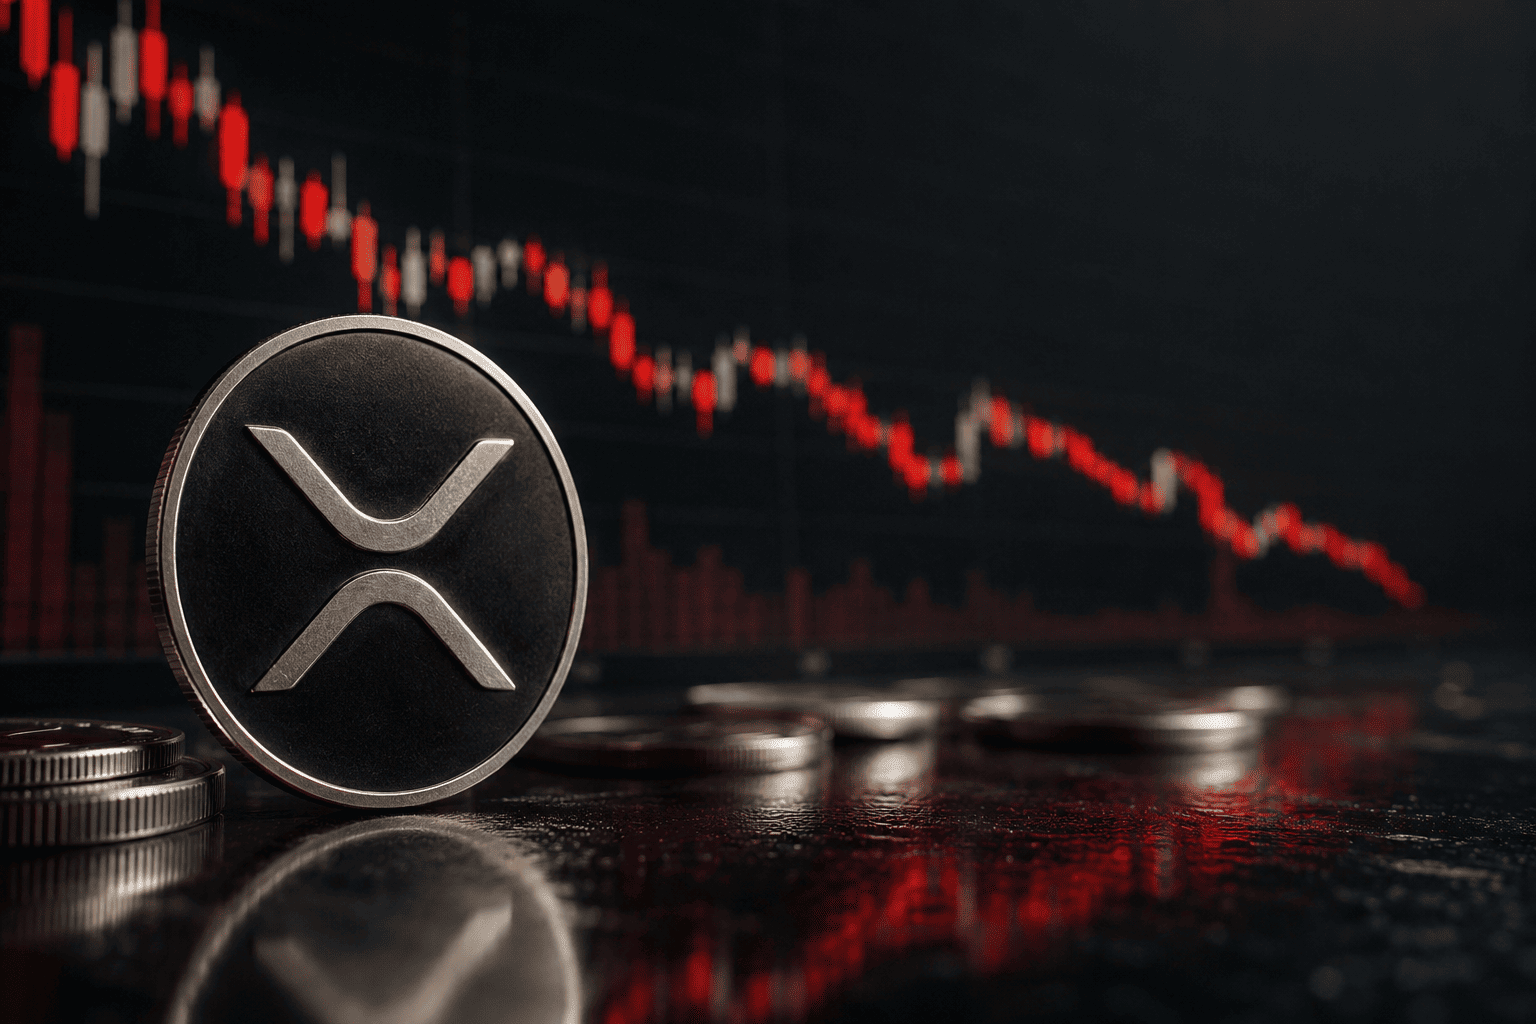
XRP has experienced a significant decline, dropping approximately 68.5% from its July 2025 high of $3.65 to trade near $1.14, a level not seen in roughly 19 months. The selloff has accelerated recently, with the token losing 11.8% over the past week and nearly 18.9% in the last 30 days. This sharp downturn has shifted market attention to the psychologically important $1 level, which many traders now view as the next major support zone.
The broader crypto market sentiment, particularly Bitcoin's performance, and XRP's ability to regain momentum in tokenization and institutional adoption will likely determine whether the token can hold above current levels.

Technical Picture Deteriorates
From a technical perspective, XRP has broken below the $1.27 support level, which now appears to be acting as overhead resistance. Although the token rebounded from around $1.05 to $1.14, the recovery was accompanied by a roughly 44% decline in trading volume. Analysts often view such price action with caution, as a rebound on falling volume can indicate limited buying conviction.
Momentum indicators reflect the recent weakness. The 14-day Relative Strength Index (RSI) has fallen below 31, placing XRP in oversold territory. While oversold readings can sometimes precede a relief rally, they can also persist during strong downtrends, meaning traders will likely look for confirmation from price action and volume before calling a durable bottom.
On the weekly chart, XRP is trapped inside a descending parallel channel that has capped price action since its 2025 peak. The Aroon Down indicator is sitting near 85.71% versus an Aroon Up of just 35.71%, showing sellers have maintained control of the trend. The daily and weekly MACD remains below zero, with the signal line above the MACD line, another sign the larger bearish structure is still intact.
The 200-day moving average, sitting at $1.6179, is now a distant ceiling, and the more immediate battle is around $1.10. A daily close below $1.10 could push XRP toward $1.09, and a breakdown through $1.09 would open the door to sub-$1 price action. Ali Martinez, a widely followed crypto analyst, has already flagged $0.90 as his key level to watch, describing it as a potential long-term buying opportunity if XRP reaches it.
On-Chain Metrics Crumble
Part of the long-term investment case for XRP has been its exposure to the growing real-world asset (RWA) tokenization market. The XRP Ledger (XRPL) has often been viewed as a potential platform for institutional asset management, particularly as the tokenized asset market is projected to expand significantly over the coming years.
However, several on-chain indicators have recently weakened. According to data cited by The Motley Fool, the XRPL currently hosts about $384.5 million in tokenized assets, down 11% over the 30 days ended June 5, interrupting a prolonged period of growth. More notably, 30-day tokenized asset transfer volume on the network has fallen 59% to roughly $54.1 million. Lower transfer activity can reduce fee generation and capital flows, potentially weakening one of the key arguments for XRPL's role in the tokenization sector. XRPL's share of the tokenized asset market now stands at just over 1%, while competing blockchain networks continue to gain ground.
There are, however, some counterbalancing trends. The number of RWA holders on XRPL increased 275% over the same 30-day period to 105 holders, while stablecoin transfer volume on the network rose 118% to $4.5 billion. The data suggests that capital activity on XRPL remains healthy overall, although growth is increasingly being driven by stablecoin usage rather than the tokenized asset segment that many XRP bulls have highlighted as the network's key differentiator.
Macro Catalysts Ahead
The most immediate macro catalyst is the US CPI data due on June 10. Hotter-than-expected inflation would likely push the Federal Reserve further away from rate cuts, strengthening the dollar and putting additional pressure on risk assets, including crypto. XRP has already been weighed down by stronger labor market data that reduced rate-cut expectations, as well as a spike in WTI crude oil above $94 per barrel following renewed military exchanges between Iran and Israel.
For broader market context, see our coverage of Dow Drops 297 Points as Nasdaq Stabilizes on Chip Rebound; Earnings Season in Focus and FTSE 100 This Week: US-Iran Tensions, UK Data, New PM, and Earnings in Focus.
This article is for informational purposes only and does not constitute financial advice.