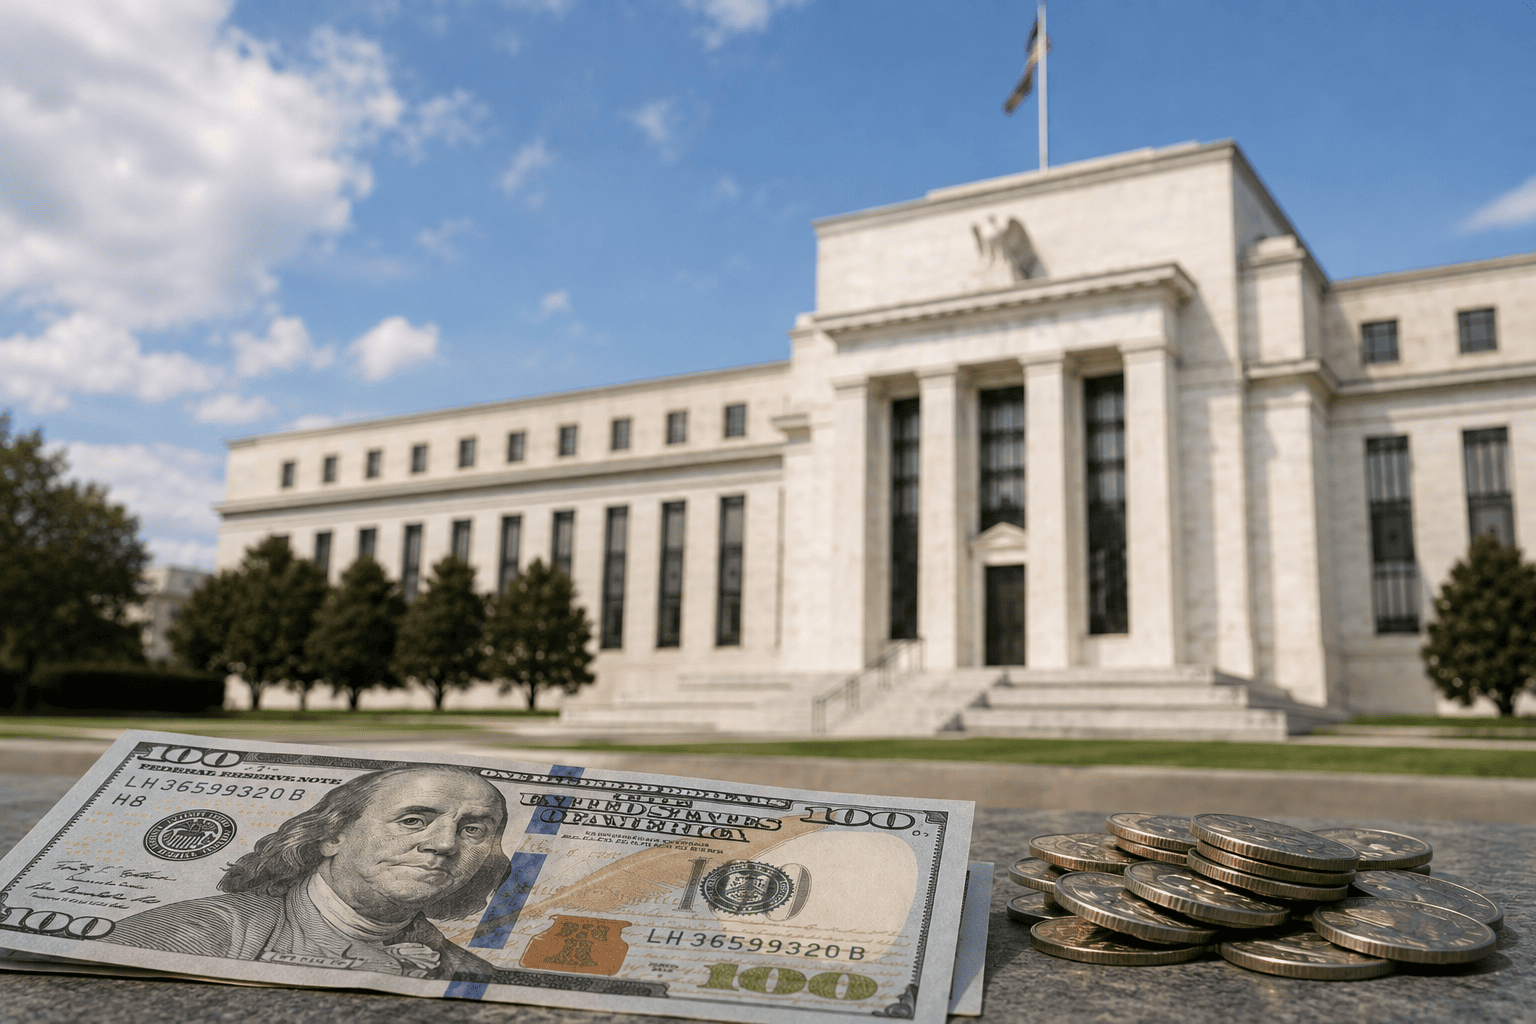
The iShares 20+ Year Treasury Bond ETF (TLT) has extended its slide, reaching its lowest point since September 2023 as the bond market faces renewed pressure. The fund recently traded at $77, marking an 11% decline year-to-date and a 46% drop over the past five years. Despite this sustained weakness, investor flows into the ETF have remained robust, suggesting that some market participants view the sell-off as an opportunity.
Inflows Continue Despite Market Turmoil
Data from ETF Db indicates that TLT attracted over $2 billion in inflows over the last month, contributing to a six-month total of $8.6 billion. Year-to-date net inflows stand at $3.6 billion, pushing the fund's assets under management to more than $46 billion. Similarly, the Vanguard Long-Term Treasury ETF (VGLT) has seen $370 million in inflows over the past 30 days and $1.4 billion over six months.

These inflows come as Treasury yields have surged dramatically. The 30-year yield has climbed to 5.67%, its highest level since May 2002, while the 10-year yield reached 5.33%, also a multi-decade high. The upward trajectory in yields has been relentless, with the 30-year yield having bottomed at 0.725% before this sustained rise.
Factors Driving the Yield Spike
Several factors are contributing to the rise in yields. The U.S. public debt has crossed $40 trillion and now stands at $40.225 trillion, raising concerns about fiscal sustainability. While a growing economy can support higher debt levels, current growth estimates of 2% to 3% are modest, partly driven by AI-related investments.
Geopolitical tensions, particularly the ongoing U.S.-Iran conflict, have pushed energy prices higher, with gasoline and diesel costs rising. This adds inflationary pressure, which typically weighs on bond prices. Additionally, major corporations like Meta, Microsoft, and Amazon are issuing billions in debt to fund data center expansions, increasing the supply of corporate bonds and competing with Treasuries for investor capital.
Technical Outlook Points to Further Declines
From a technical perspective, TLT has broken below a key support level at $78.48, which was the lowest point in May. This breakdown suggests the formation of an inverted cup-and-handle pattern, a bearish continuation signal. The ETF remains below its 50-week and 100-week exponential moving averages, and the Average Directional Index (ADX) has risen to 25, its highest since December 2023, indicating strengthening downward momentum.
Given these signals, the path of least resistance appears to be lower, with the next potential target around the psychological $75 level. However, a move above the resistance at $79 would invalidate the bearish outlook and could signal a reversal.
Investors are closely watching whether the sustained inflows will eventually stabilize the fund or if the technical and macroeconomic headwinds will continue to dominate. The coming weeks, with key economic data and Federal Reserve policy signals, will be crucial in determining the direction of long-term Treasury yields and, consequently, TLT's performance.
This article is for informational purposes only and does not constitute financial advice.