
Brent crude oil prices have retreated for four consecutive sessions, falling to approximately $93.50 per barrel after hitting a year-to-date high of $120. The pullback follows President Donald Trump's intervention to cool tensions between Iran and Israel, but underlying supply risks and technical patterns point to a possible rebound toward the $100 mark.
Geopolitical Risks Remain Elevated
The recent decline reflects market expectations that the immediate crisis between Iran and Israel has de-escalated. However, negotiations between the U.S. and Iran remain stalled, keeping the Strait of Hormuz effectively closed to significant oil traffic. Analysts warn that Israel may push for renewed conflict, which could draw in Yemen's Houthis and threaten the Bab el-Mandeb Strait. The Houthis have already stated they will block Israeli-linked vessels, potentially removing 7 million barrels per day from global supply—on top of the 13 to 20 million barrels that previously transited the Strait of Hormuz.
Inventory Levels at Critical Lows
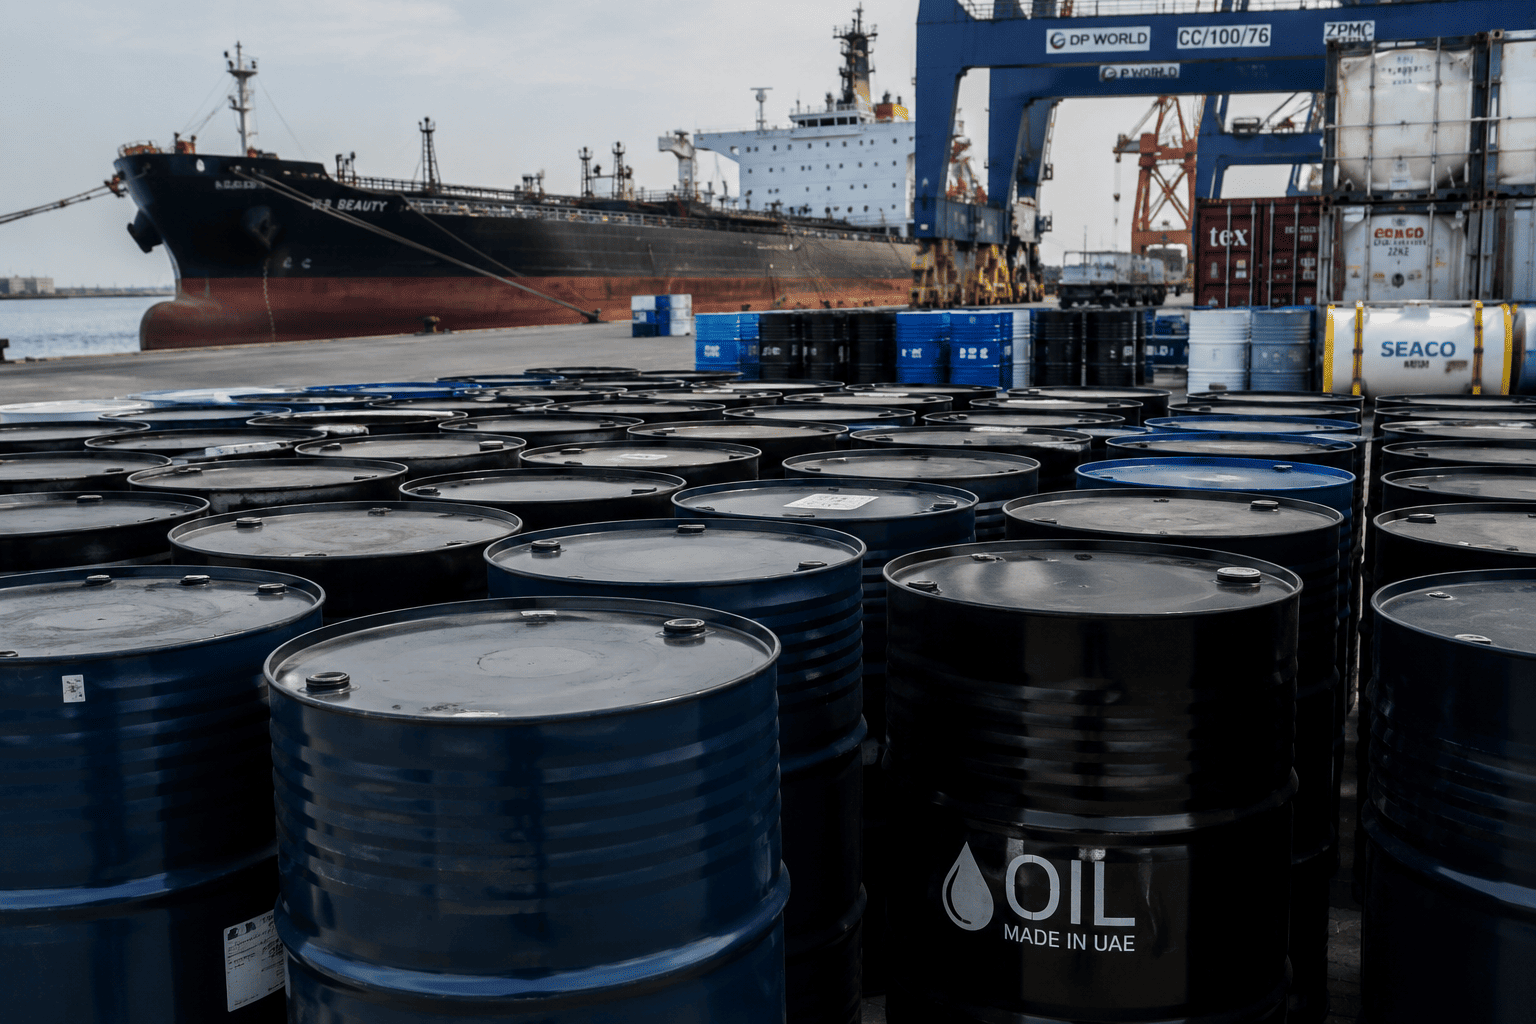
Adding to supply concerns, oil inventories in major consuming nations are dangerously low. U.S. Strategic Petroleum Reserves have fallen to 791 million barrels, the lowest since February 2024, and commercial crude stocks have dropped by 64 million barrels since the conflict began. A senior Chevron executive recently noted, "We're approaching unheard of inventory levels. I mean, really, really low levels. You can debate whether that's going to hit those really low levels in two weeks or three weeks. But once you get to that point, you'll see prices shoot up."
Technical Analysis Points to Bullish Reversal
On the daily chart, Brent crude has formed an island reversal pattern, a classic bullish reversal signal. The price is currently trading below the 50-day and 100-day exponential moving averages and has slipped under the 38.2% Fibonacci retracement level. However, the island reversal suggests that selling pressure is exhausted and a bounce toward $100 is likely. The pattern would be invalidated if prices fall below the lower boundary at $90.
For context, the broader commodities market is also reacting to geopolitical shifts. Gold has edged lower as rising yields offset safe-haven demand, while European stocks dipped when Brent first breached $90, highlighting the interconnected nature of these markets.
Outlook and Key Levels
Investors should monitor the $90 support level closely. A break below that would negate the bullish pattern, while a sustained move above $96 could accelerate gains toward $100. The combination of low inventories, unresolved geopolitical risks, and a technical reversal pattern creates a compelling case for higher prices in the near term.
This article is for informational purposes only and does not constitute financial advice.