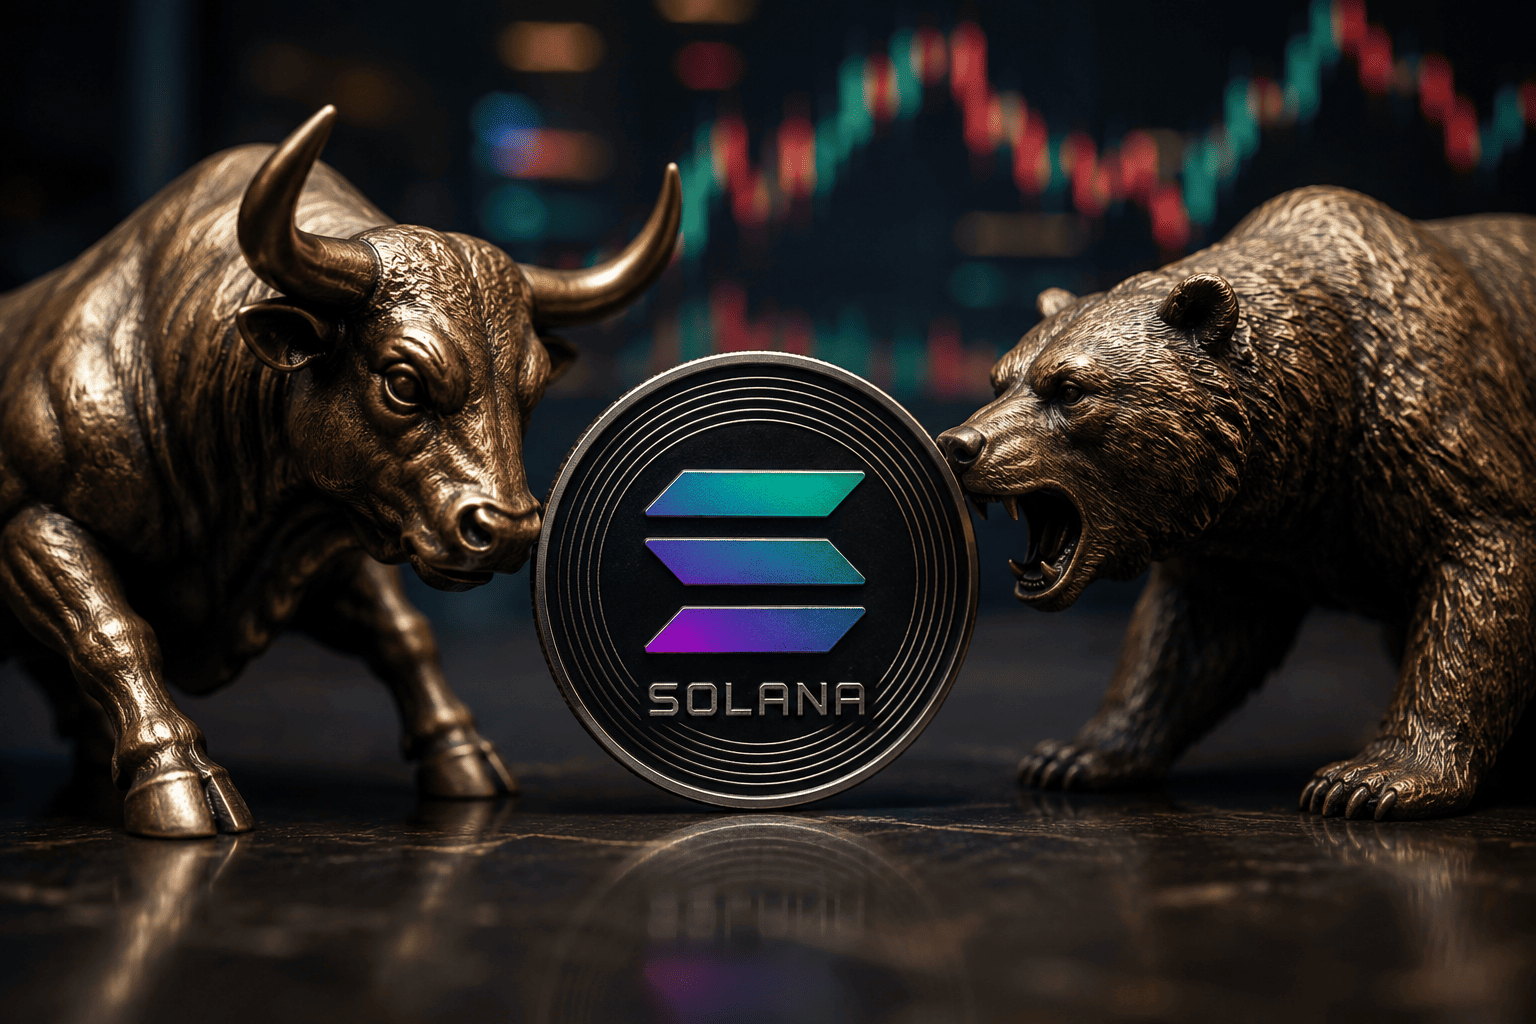
Solana (SOL) has recovered from a low near $74.20 on July 18 to trade around $78.08, but the token continues to face stiff resistance at the $80 level. Repeated rejections at this psychological barrier have left traders waiting for a decisive breakout, even as on-chain activity and institutional inflows provide underlying support.
Governance Exploit Shakes Confidence
A significant setback for the Solana ecosystem came when an attacker drained nearly $20 million from the BonkDAO treasury. The exploit involved spending approximately $4.4 million to acquire enough BONK tokens to cross the governance threshold, then pushing through a malicious proposal that received 99.9% approval. Although the attack did not compromise Solana's base-layer blockchain, it exposed vulnerabilities in BonkDAO's governance structure, including low voter participation, concentrated voting power, and the absence of an execution delay. The incident has renewed concerns about governance security across decentralized applications built on the network.
Macroeconomic Headwinds Limit Upside
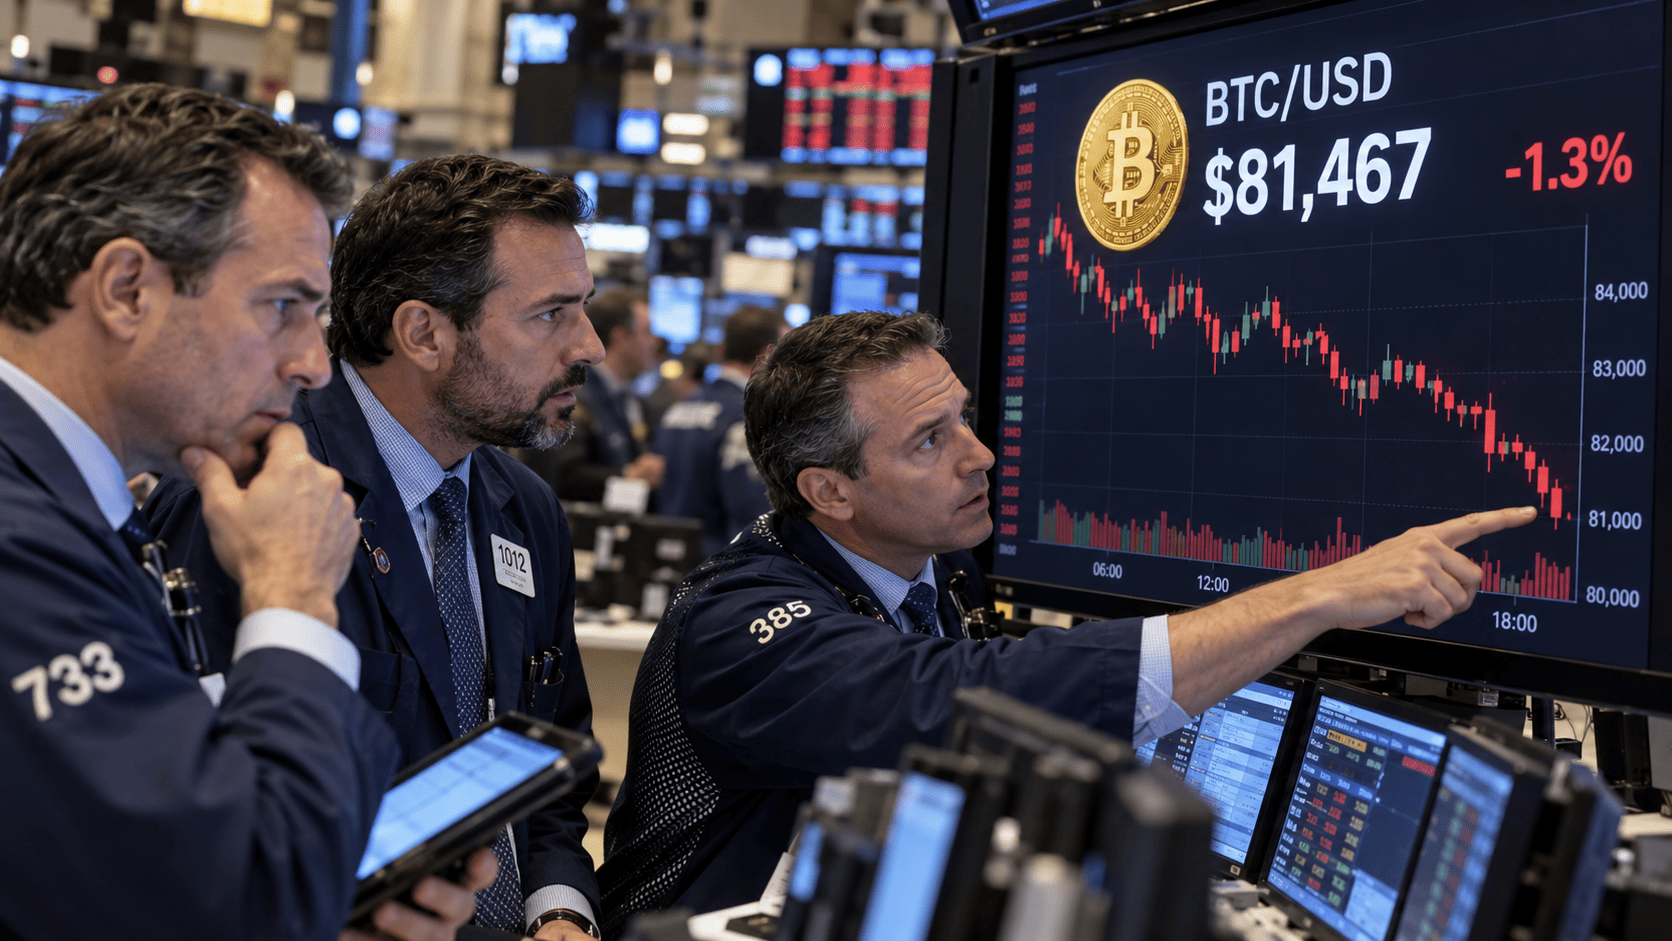
Outside the crypto market, macroeconomic conditions have also constrained Solana's price momentum. Brent crude settled at $91.01 on July 21 following renewed tensions between the United States and Iran, while threats by Yemen's Houthi group against Red Sea shipping routes raised concerns about global energy supplies. The U.S. Dollar Index climbed to 101.16 as traders increased expectations that elevated oil prices could complicate the Federal Reserve's inflation fight. Historically, a stronger dollar and expectations of tighter monetary policy reduce appetite for higher-risk assets, leaving cryptocurrencies like Solana vulnerable to slower capital inflows. For context, similar macro pressures have weighed on other digital assets, as seen in Bitcoin's recent dip below $63K amid Iran tensions.
Institutional Inflows Provide a Floor
Despite these headwinds, institutional demand has continued to offer support. Data from SoSoValue shows that U.S. spot Solana exchange-traded funds attracted $8.4 million in net inflows on July 6, the strongest daily intake in nearly two months. Earlier in July, these products also recorded approximately $5.8 million in weekly inflows without a single day of net outflows. This steady institutional interest contrasts with the broader market's cautious stance.
On-Chain Activity Reaches New Highs
Network fundamentals remain robust. According to Blockworks' Solana Q2 Token Holder Report, tokenized real-world asset trading on Solana hit a record $5.8 billion during the second quarter of 2026, a 114% increase from the previous quarter. Tokenized equities drove most of the growth, with trading volume climbing from $1.1 billion to $4.8 billion quarter-over-quarter. The Solana Foundation reported that the network accounted for roughly 97% of global spot tokenized stock trading during the period. The expansion is attributed to Solana's low transaction fees, sub-second settlement speeds, and infrastructure like Superstate's Direct Issuance Programs.
However, retail demand has cooled. Solana's Real Economic Value (REV) revenue declined 43% quarter-over-quarter to $51 million, while spot decentralized exchange volume totaled $160.8 billion, indicating slower fee generation after the earlier surge in speculative activity. This pattern of reduced retail participation is not unique to Solana; similar trends have been observed in other tokens, such as PEPE consolidating below its 50-day EMA.
Technical Analysis: Resistance at $80 Remains Key
From a technical perspective, Solana has formed a sequence of higher lows on the 4-hour chart since July 18, with the Relative Strength Index (RSI) near 61, indicating buyers still hold an advantage without entering overbought territory. The Moving Average Convergence Divergence (MACD) remains above its signal line, though the shrinking positive histogram suggests bullish momentum is slowing as price approaches resistance. The $79–$80 zone is the first barrier bulls need to clear; a sustained move above it could allow SOL to retest the $82–$84 area, where sellers rejected the token earlier this month.
On the daily chart, SOL has reclaimed its 20-day exponential moving average near $76.80, showing improved short-term momentum after the June selloff. However, the token continues to trade well below its 50-day EMA around $93.60, indicating the medium-term trend remains bearish. A break above $80 would be the first step toward reversing that trend.
Upcoming Protocol Changes Could Shift Dynamics
Looking ahead, the network is preparing the Alpenglow upgrade, along with proposals SIMD-550 and SIMD-553, which aim to refine Solana's inflation schedule and dynamic token burn mechanism. These changes are designed to improve how value accrues to SOL over time. While the market has yet to fully price in these developments, they could provide additional conviction for buyers if SOL manages to break above its nearby resistance levels.
This article is for informational purposes only and does not constitute financial advice.