Solana extended its decline on Friday, dropping 3.5% to trade near $80.54, as a broad cryptocurrency sell-off pushed the token briefly below the psychological $80 mark. The asset has now lost roughly 10% since the start of the week, continuing a correction that began after SOL peaked above $120 in early October.
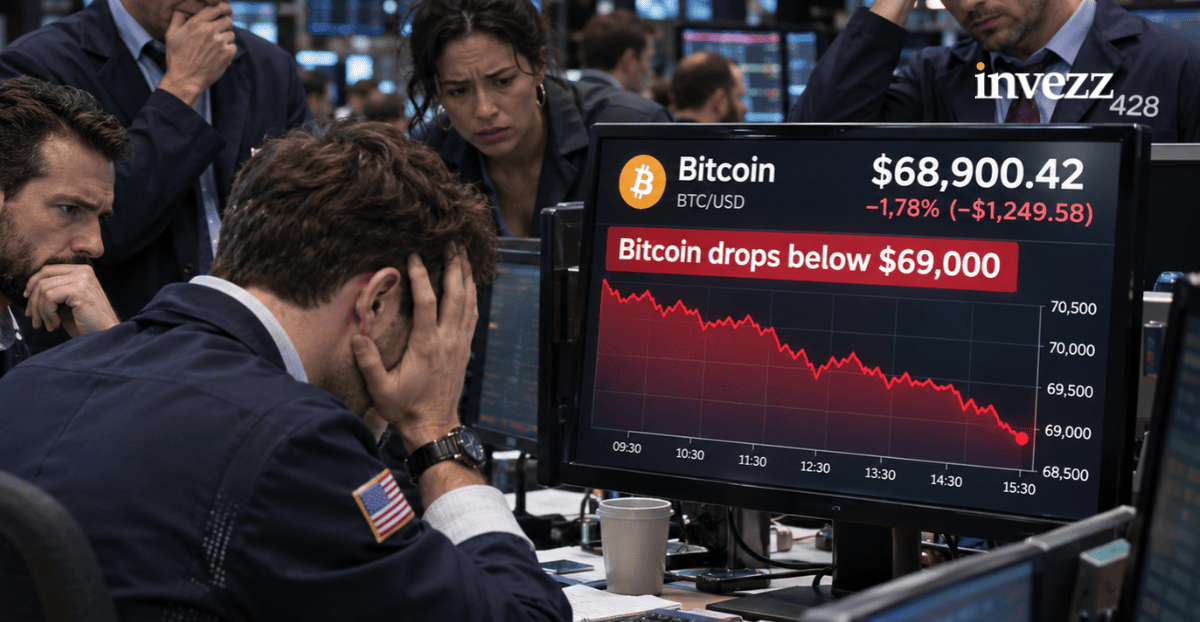
The latest slide coincided with Bitcoin falling below $70,000, triggering a wave of forced selling across leveraged positions. According to CoinGlass, approximately $1.64 billion in crypto derivatives were liquidated over the past 24 hours, with long positions accounting for $1.43 billion of that total. This suggests that traders who had bet on higher prices bore the brunt of the losses.

The sell-off also came as technology stocks weakened, following reports surrounding Nvidia CEO Jensen Huang's resignation amid scrutiny over personal relationships. Bitcoin and several major altcoins have recently shown sensitivity to movements in AI-related equities, and Solana was not immune to that correlation.
Derivatives and spot flows turn cautious
Solana's derivatives market is showing signs of fading demand. SOL futures open interest fell 6.3% in the last 24 hours to $4.82 billion, according to CoinGlass. Spot markets also saw outflows of $8.80 million, indicating that participants are trimming exposure as the decline extends.
The taker buy-to-sell ratio for SOL stands at around 0.91, remaining below 1 since late July. A reading under 1 implies that selling activity is outpacing buying, giving bearish traders the upper hand in the short term.
Death cross and broken trendline weigh on outlook
Solana's daily chart has deteriorated significantly since its early-October high. The 50-day exponential moving average (EMA) sits at $97.55, while the 200-day EMA is near $98.62. The 50-day EMA has crossed below the 200-day EMA, forming a bearish pattern known as a death cross, which typically signals weakening medium-term momentum relative to the longer-term trend.
SOL has also broken below a previously supportive ascending trendline, now positioned around $91.20. That former support could now act as resistance if the token attempts a rebound. Momentum indicators reinforce the bearish view: the daily Relative Strength Index (RSI) has fallen to approximately 21, placing Solana in deeply oversold territory, while the Moving Average Convergence Divergence (MACD) remains below zero with its signal line near -0.81.
Key levels to watch
If the bearish trend persists, Solana's immediate downside support stands at $77.60. This horizontal level represents a critical area where buyers could attempt to stabilize the price. With SOL trading around $80, the market is already approaching this zone. A successful defense of $77.60 could allow for consolidation or a temporary bounce.
However, a decisive breakdown below that level would weaken the technical outlook further, exposing the next significant downside target at $67.50. On the upside, the first resistance is at $87.46, followed by a more substantial barrier around $95.82. Beyond that, the 50-day and 200-day EMAs form a concentrated resistance zone near $97.55 and $98.62, which could prove difficult to overcome without stronger market demand.
Despite the bearish signals, a recovery is possible if buyers defend $77.60. A sustained move above $87.46 would indicate improving short-term momentum, but a breakout above the EMA cluster would be needed to shift the technical outlook in favor of bulls.
This article is for informational purposes only and does not constitute financial advice.