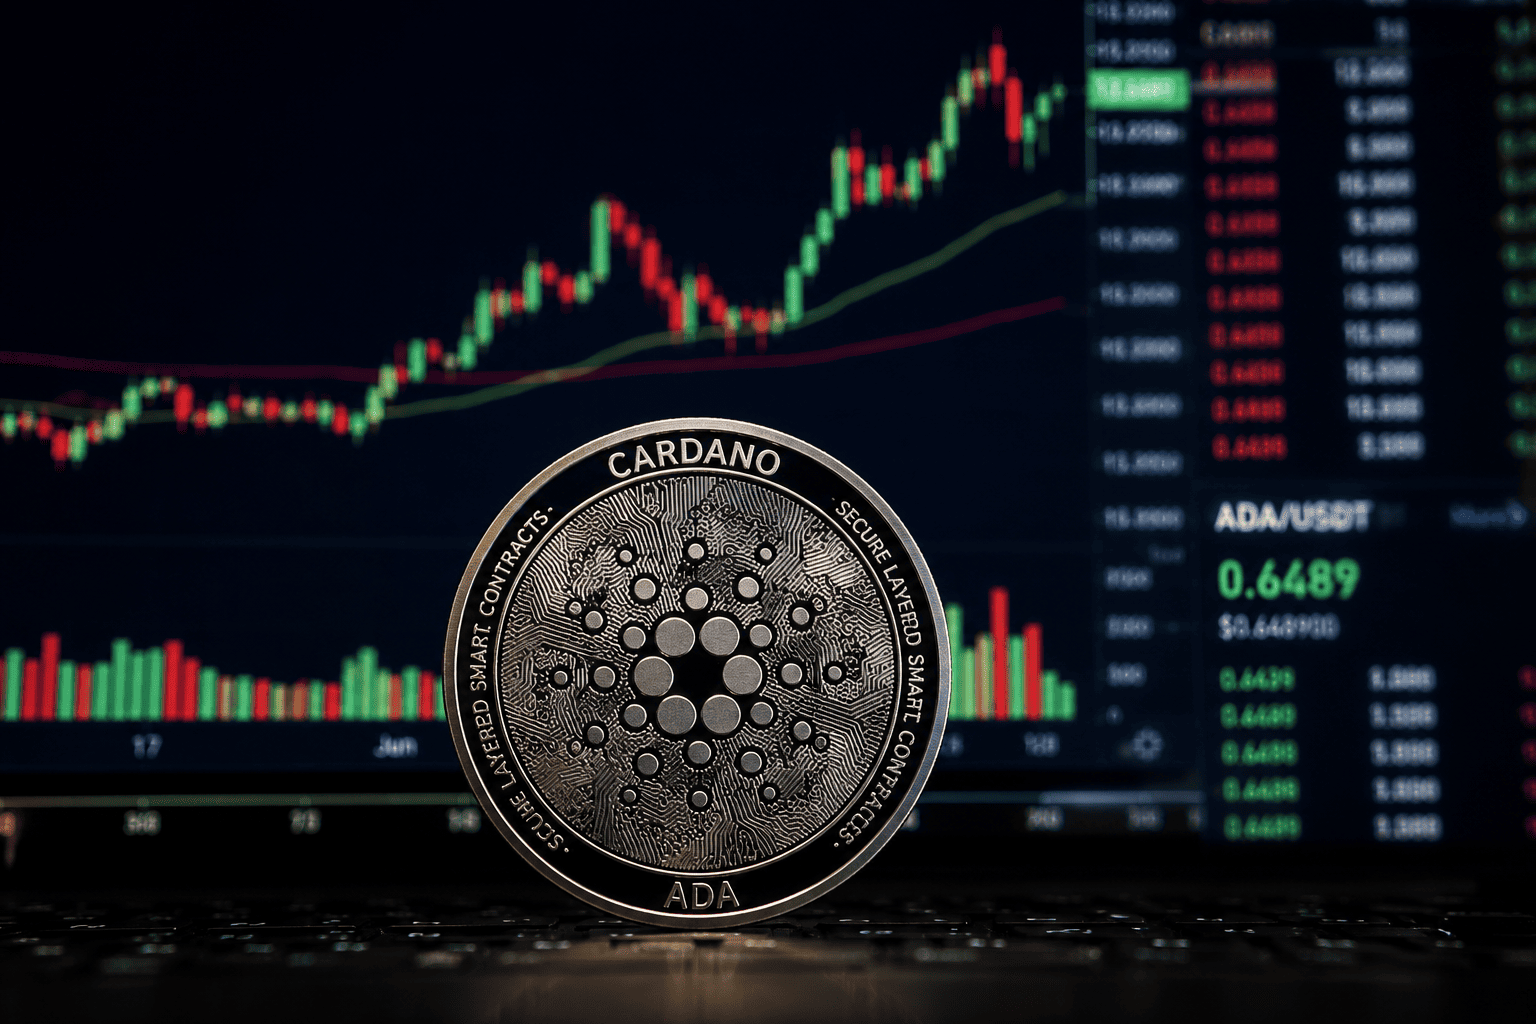
The cryptocurrency market showed mixed signals over the weekend, with Bitcoin hovering above $84,000 and total market capitalization around $2.89 trillion. Among the notable movers, Quant (QNT), Zcash (ZEC), and Cardano (ADA) have each posted significant gains, driven by distinct catalysts. However, technical indicators across all three tokens now suggest that the recent rallies may be losing steam, raising the possibility of short-term corrections.
Quant (QNT) Price Analysis
Quant has been one of the standout performers, climbing for four consecutive sessions to reach its highest level since October 2022. The rally follows a major milestone: several of the United Kingdom's largest banks adopted Quant's technology to facilitate tokenized deposits. This development has bolstered investor confidence in the network's real-world asset tokenization capabilities, positioning it as a strong competitor to Chainlink.

From a technical perspective, QNT broke out of a falling wedge pattern, a classic bullish reversal signal. However, the Relative Strength Index (RSI) has surged to 93.50, its highest reading in over a year, indicating that the token is deeply overbought. Other momentum oscillators, such as the Stochastic Oscillator and MACD, are also at elevated levels, suggesting that the buying frenzy may be nearing exhaustion.
Should the token reverse, the first key support to watch is the psychological $100 level. A break below that could open the door to further downside, with the next major support at $84.71, a level that previously acted as resistance in May.
Zcash (ZEC) Price Outlook
Zcash has also enjoyed a robust uptrend, trading near its yearly high of $1,693, a stark contrast to its year-to-date low of $188. The surge is attributed to growing demand for privacy-focused cryptocurrencies and rising futures open interest. The token has decisively broken above the $1,288 resistance level, which had capped gains since September.
Despite the bullish momentum, ZEC's RSI is showing a bearish divergence, where price makes higher highs but momentum fails to confirm. This pattern often precedes a pullback. Additionally, the token remains above all major moving averages, but a mean reversion could bring it back to the $1,288 support level, which now acts as a potential floor.
Cardano (ADA) Price Forecast
Cardano has been in a steady uptrend, climbing from a June low of $0.1388 to its current price of $0.2532. The token is trading within a rising channel, characterized by higher highs and higher lows, and has recently broken above its 50-day moving average. The Percentage Price Oscillator (PPO) has also surged to multi-month highs, confirming the bullish momentum.
Looking ahead, ADA faces two potential scenarios. A breakout above the upper boundary of the channel could propel the token toward the psychological $0.300 level. Conversely, a failure to sustain the rally might lead to a retest of the channel's lower boundary, which would represent a significant pullback from current levels.
While the fundamental stories behind these tokens are compelling, the technical indicators across all three suggest that the recent rallies may be overextended. Investors should monitor key support levels and be prepared for potential volatility in the near term.
This article is for informational purposes only and does not constitute financial advice.

