
Ethereum has staged a recovery of more than 6% from its recent lows, with technical indicators and analyst commentary pointing to a possible rebound after one of the asset's sharpest declines this year. However, the path to reclaiming the $1,800 level remains uncertain as key resistance looms.
Ether traded near $1,666 on June 8, up about 3.5% over the previous 24 hours after briefly climbing above $1,700 earlier in the session, according to data from crypto trading platforms. The move came as Bitcoin reclaimed the $63,000 level, helping lift sentiment across the digital asset market and triggering a wave of short liquidations in oversold cryptocurrencies.
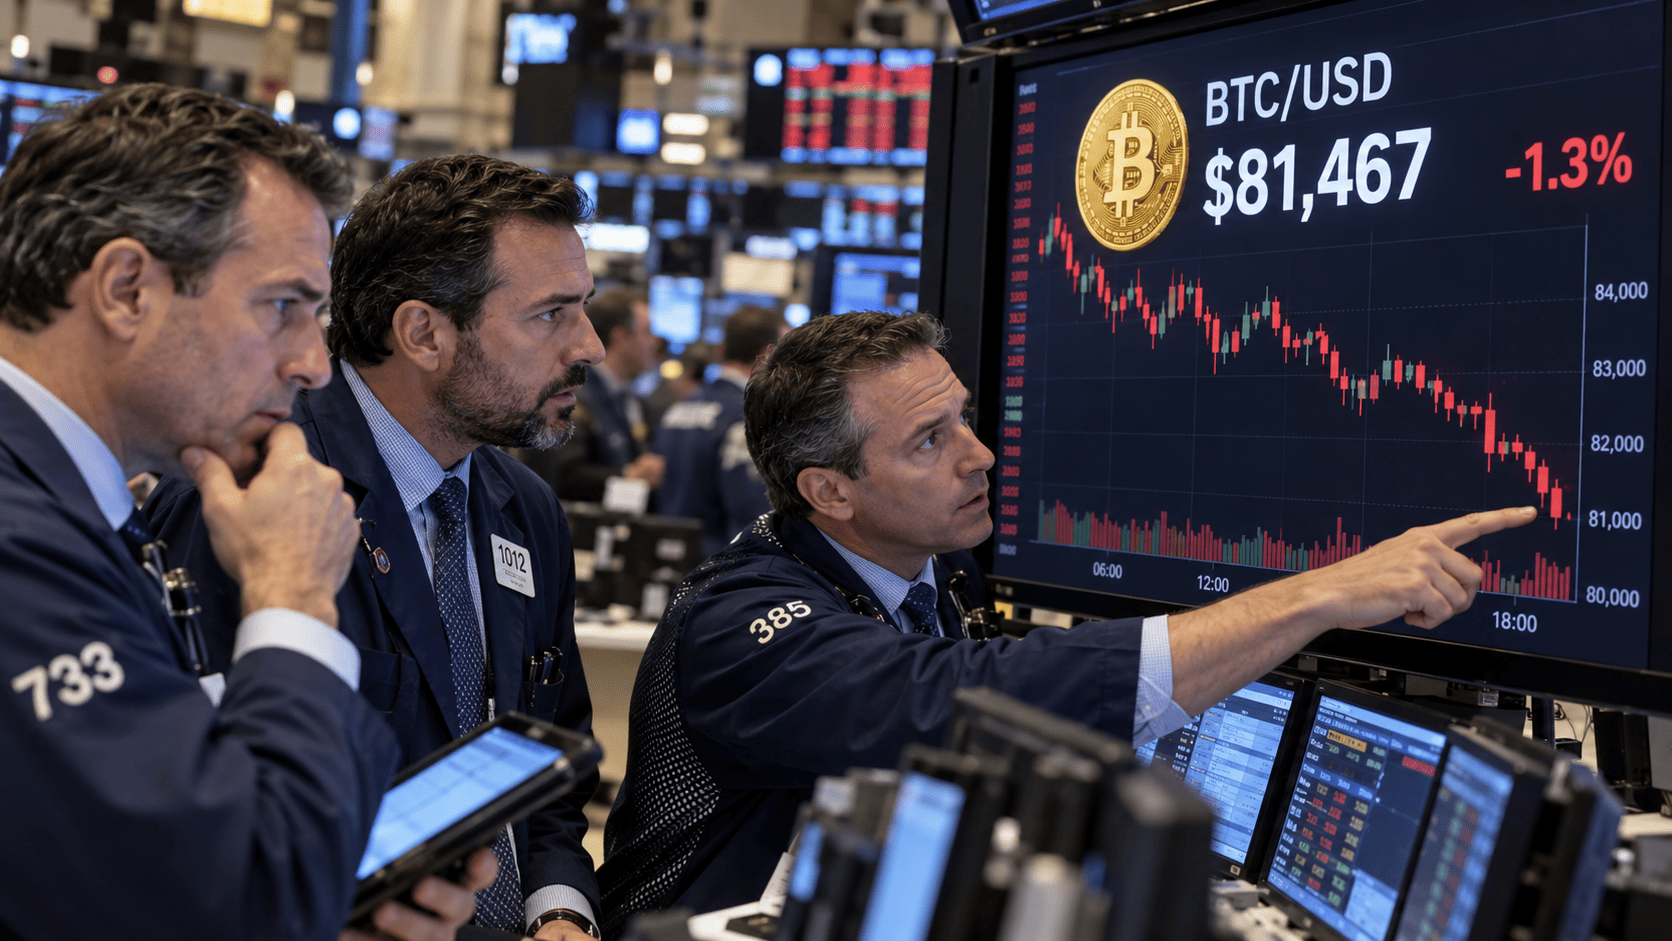
Market participants have linked part of the recovery to a relief rally following a steep selloff. Ethereum had fallen below several major support zones in recent weeks, leaving traders heavily positioned for further downside. As prices stabilized near the $1,500 to $1,600 area, bearish positions began unwinding, adding fuel to the rebound.
Ethereum Faces Key Resistance Zone After Bounce
While momentum has improved, analysts say Ethereum still faces important hurdles before a larger recovery can take shape. Crypto analyst Ted Pillows identified the $1,750 to $1,800 range as the key area to watch. According to Pillows, a successful move above that zone could open the door to further gains toward the $1,900 region. His analysis also warned that failure to reclaim those levels could leave Ethereum vulnerable to another test of support below $1,500.
Technical indicators from TradingView charts paint a similar picture. On the 4-hour timeframe, Ethereum remains below its 20, 50, 100 and 200 exponential moving averages, which are positioned near $1,655, $1,756, $1,877 and $2,006. Although price has recovered enough to challenge the shortest-term average, the longer-term trend remains under pressure while those higher moving averages continue to slope downward.
Momentum indicators are showing signs of improvement. The Relative Strength Index on the 4-hour chart has recovered from deeply oversold readings below 20 and climbed back toward 47, easing some of the intense selling pressure that dominated trading earlier in the week. On the daily chart, Ethereum recently broke below a heavily traded support region around $1,900 to $2,000. Volume profile analysis identifies that area as one of the market's largest historical trading zones, which means it could now act as resistance if buyers continue pushing prices higher.
Meanwhile, crypto analyst Ali Martinez recently pointed out that Ethereum's 3-day chart flashed a TD Sequential buy signal. According to Martinez, the indicator printed a "9" count near the recent lows around $1,612, a pattern that traders often associate with seller exhaustion after prolonged declines.
Macro Pressures Continue to Weigh on Sentiment
Even as traders focus on the rebound, several analysts have pointed to economic conditions that continue to limit risk appetite. Recent US labor market data came in stronger than expected, reinforcing expectations that the Federal Reserve could maintain higher interest rates for longer. Market observers have argued that rising Treasury yields have drawn capital toward lower-risk assets and reduced liquidity available for speculative investments such as cryptocurrencies.
Institutional developments have also remained in focus. CME Group launched its market-cap-weighted crypto index futures on June 8, introducing a product that includes Bitcoin, Ethereum and several other major digital assets. Some market participants viewed the launch as an additional sentiment catalyst that coincided with the latest recovery attempt.
For now, analysts appear divided between a short-term rebound scenario and the possibility of another leg lower. Martinez's TD Sequential signal and the recovery from oversold conditions suggest sellers may be losing momentum, while Ted Pillows' analysis indicates that Ethereum still needs to reclaim the $1,750 to $1,800 region before a stronger bullish case can emerge. For broader market context, see our coverage of Dow Drops 297 Points as Nasdaq Stabilizes on Chip Rebound; Earnings Season in Focus and Ethereum Bulls Eye Breakout Above 100-Day EMA as Exchange Outflows Surge.
This article is for informational purposes only and does not constitute financial advice.