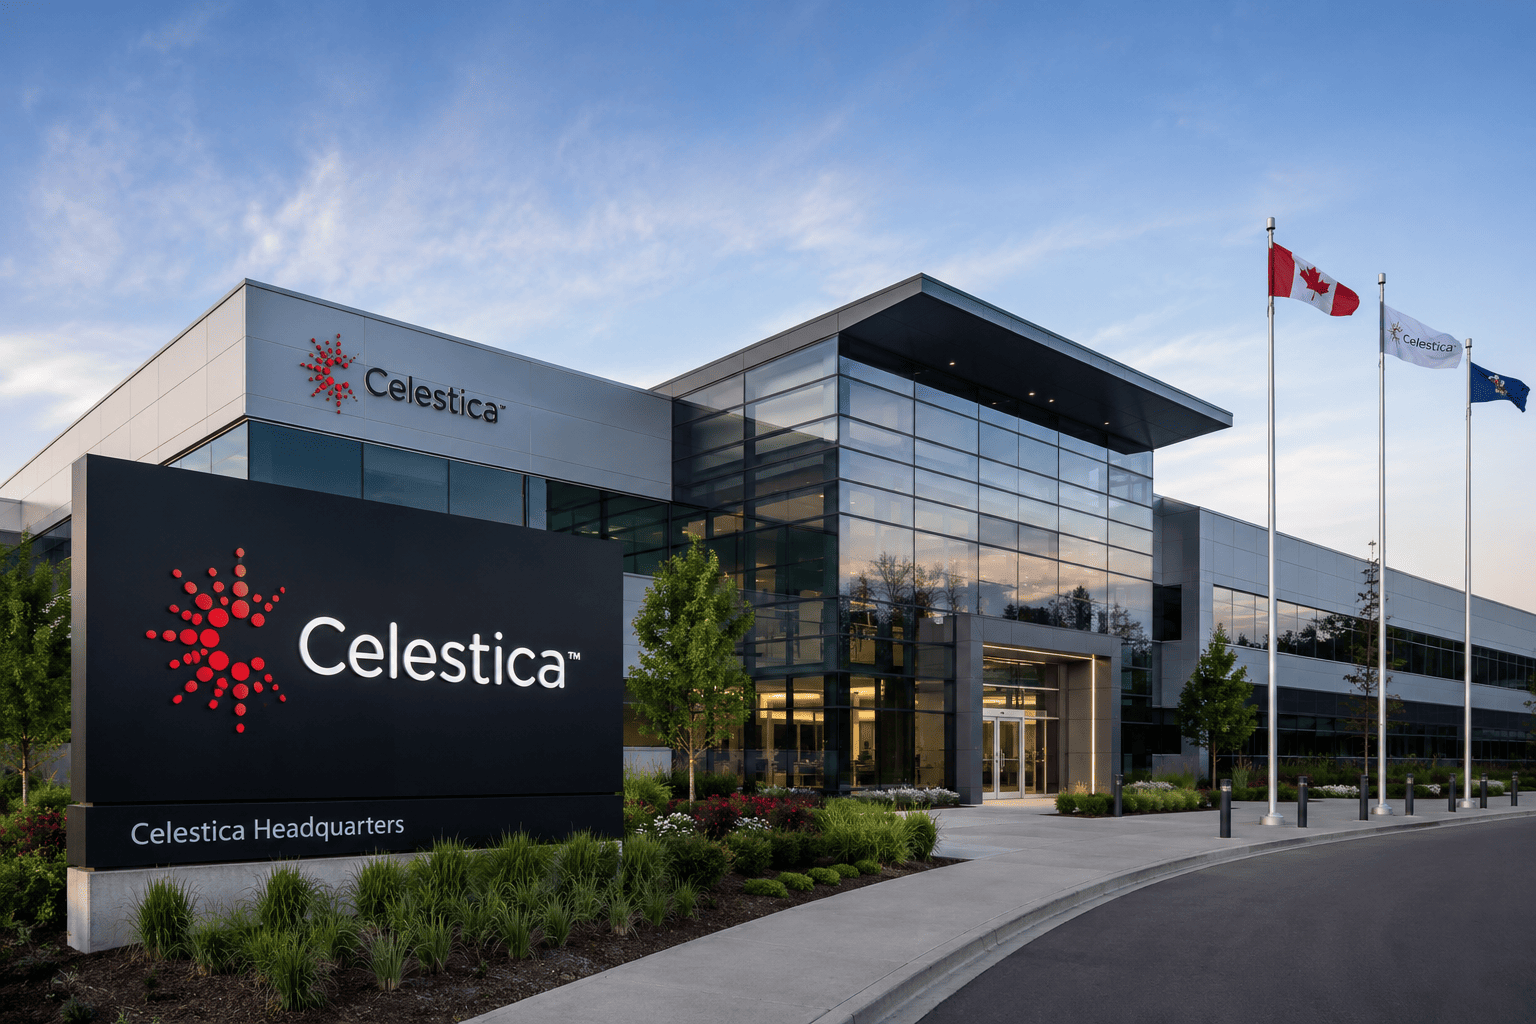
Celestica (NYSE: CLS) shares have fallen more than 35% from their 2025 peak, erasing all gains made earlier this year and entering bear market territory. The stock now trades around $307, down from a June high of $472. The decline mirrors a broader pullback in AI-related names, but the company's upcoming earnings report could determine whether this is a buying opportunity or the start of further downside.
Celestica's AI-Driven Growth Story
Celestica has emerged as a key Canadian proxy for artificial intelligence, providing hardware design, electronics manufacturing, supply chain management, and testing services to major tech firms. Its top ten clients—including Alphabet, Meta Platforms, Amazon, and Cisco—account for roughly 10% of total revenue. As these companies ramp up AI investments, demand for Celestica's services has surged.

In its most recent fiscal year, revenue jumped 53% to $4.05 billion, near the top end of guidance. Gross margin improved to 10.8%, and operating earnings reached $272 million, reflecting the company's pricing power and operational leverage.
Earnings Expectations and Valuation Concerns
Celestica is scheduled to report next week, and analysts are broadly optimistic. The consensus estimate calls for revenue of $4.39 billion, a 51% year-over-year increase. Earnings per share are projected at $2.31, up from $1.39 in the same quarter last year. The company has a history of beating estimates, having topped EPS forecasts by $0.08 in its last report.
However, the stock's forward price-to-earnings ratio of 32 remains well above its historical average. As noted in our coverage of UBS's outlook on AI stocks, elevated valuations leave little room for disappointment. A strong earnings beat and raised guidance may be necessary to stabilize the stock.
Technical Picture: Head-and-Shoulders Pattern
From a technical standpoint, Celestica's chart shows a head-and-shoulders pattern that broke below the neckline at $324. The 50-day and 100-day exponential moving averages are nearing a bearish crossover, a signal that often precedes further declines.
On the positive side, the stock recently formed a morning star candlestick pattern, a potential bullish reversal signal. But for this to gain traction, CLS needs to reclaim the $324 resistance level and then clear the psychological $350 mark. A drop below the morning star's low at $282 would invalidate the bullish setup and open the door to deeper losses.
What to Watch
Investors will focus on revenue growth, margin trends, and forward guidance. With Alphabet planning $80 billion in capital expenditures this year, Celestica's pipeline appears robust. Yet the stock's recent slide suggests the market is already pricing in a high bar. As we noted in our analysis of BlackBerry's AI-driven decline, even strong fundamentals may not be enough if sentiment turns.
The broader tech selloff, driven by geopolitical uncertainty and profit-taking, has hit AI proxies hard. The recent Dow drop and Nasdaq stabilization highlight the market's sensitivity to earnings season. For Celestica, next week's report will be a critical test of whether its AI story can withstand the current headwinds.
This article is for informational purposes only and does not constitute financial advice.