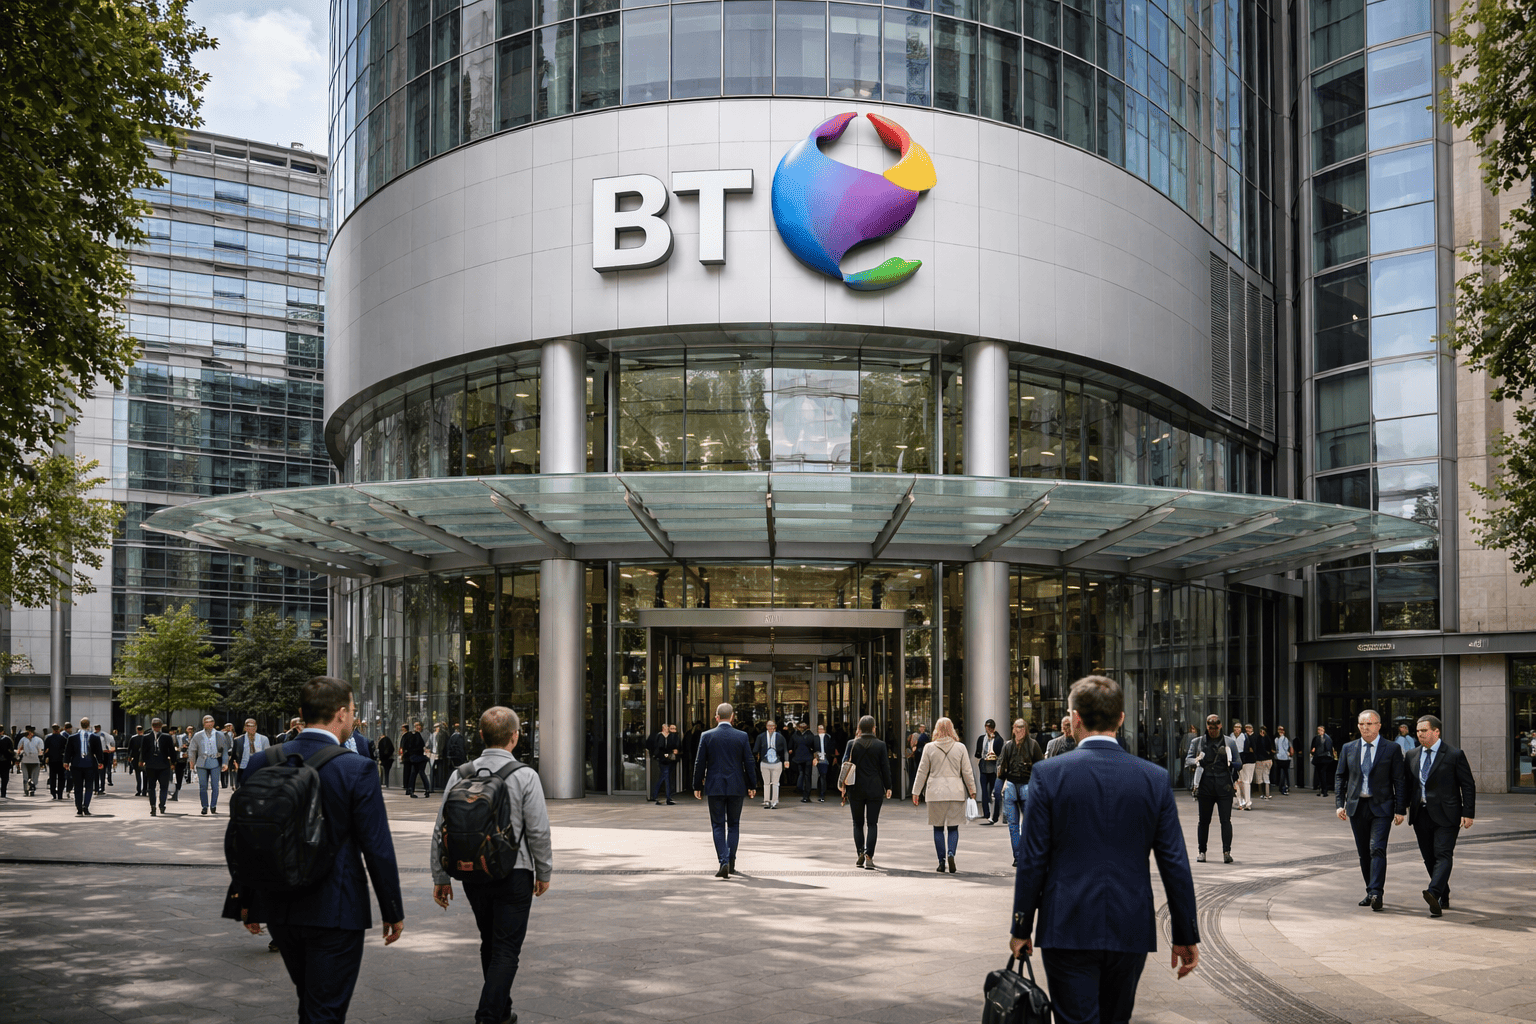
BT Group shares have rallied sharply over the past year, reaching levels not seen since 2016. The stock, currently trading around 218p, has climbed from a low of 171p in November last year. Technical analysis suggests further upside may be in store, driven by a classic bullish pattern on the daily chart.
Bullish Chart Patterns Signal Potential Breakout
The daily chart reveals a cup-and-handle formation, a widely recognized bullish continuation pattern. The stock has completed the rounded bottom (the cup) and is now consolidating near the top (the handle). Within this handle, a smaller inverted head-and-shoulders pattern has emerged, with a neckline at the year-to-date high of 220p. A decisive move above this level could trigger a rally toward the psychological 250p mark. The pattern would be invalidated if the stock falls below the 198p year-to-date low.

Additionally, BT shares have consistently traded above their 50-day and 100-day exponential moving averages, indicating that bullish momentum remains intact.
Broadband Losses Offset by Fiber Growth
BT continues to face headwinds in its legacy broadband business, losing 210,000 lines in the last quarter, with full-year losses projected at 850,000. However, its fiber division has been a bright spot, adding thousands of new customers and now serving over 21 million premises. This shift has helped mitigate some of the revenue pressure.
Overall, third-quarter revenue fell 4% year-over-year to £4.97 billion, with declines across all segments. BT Business Solutions has been a particular drag, as corporate clients seek alternatives. International revenue dropped 14% to £522 million in the quarter, and 3% in the first nine months to £3.8 billion.
Profitability and Dividend Outlook Support Valuation
Despite the revenue decline, analysts expect BT's profitability to improve. Management's cost-cutting and efficiency initiatives are projected to boost EBITDA from £8.21 billion in the current fiscal year to £8.3 billion by FY'28. This focus on margins has been a key factor supporting the stock's recent performance.
Dividend growth also remains a positive catalyst. The dividend per share is forecast to rise from 8.39p in FY'26 to 9.05p in FY'28, providing a steady income stream for investors. Revenue is expected to continue declining, with FY'26 consensus at £19.6 billion (down 3.4% year-over-year) and FY'27 at £19.3 billion (down 1.8%).
For broader market context, see our analysis of FTSE 100 Watch: Airtel Africa, BT Group, Compass Group in Focus Next Week.
Investors may also find relevant insights in Volvo Group Q2 Profit Surges 35% on North American Truck Demand, Raises EU Outlook.
This article is for informational purposes only and does not constitute financial advice.