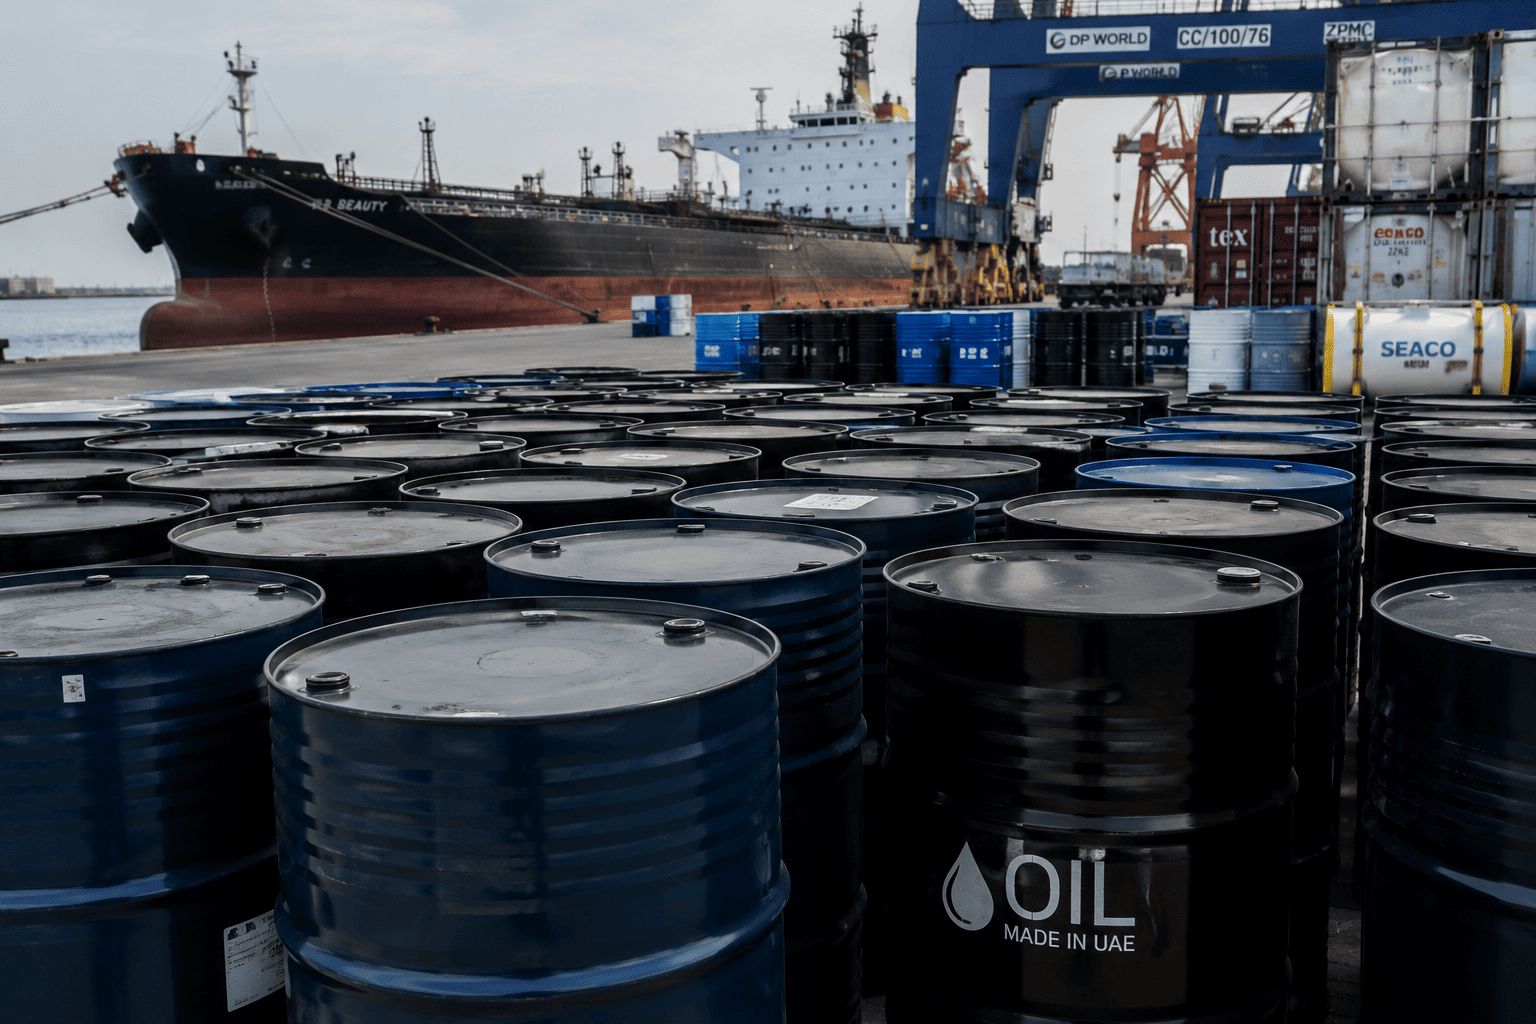
Brent crude oil prices have been trading in a narrow band this week, hovering around $105.68, as market participants weigh the implications of the recent closure of Saudi Arabia's East-to-West pipeline. The global benchmark remains below its monthly high of $109.96, yet technical indicators suggest a potential upward breakout.
Saudi Arabia's contingency plans
In response to last week's attack on the East-to-West pipeline by Iran-backed groups, Saudi Arabia is reportedly considering ship-to-ship transfers near the Gulf of Oman. This move aims to mitigate the loss of over 7 million barrels of oil supply in the near term. The kingdom has pledged to repair the pipeline and terminals swiftly, but the situation remains fluid, and the threat of further attacks persists.
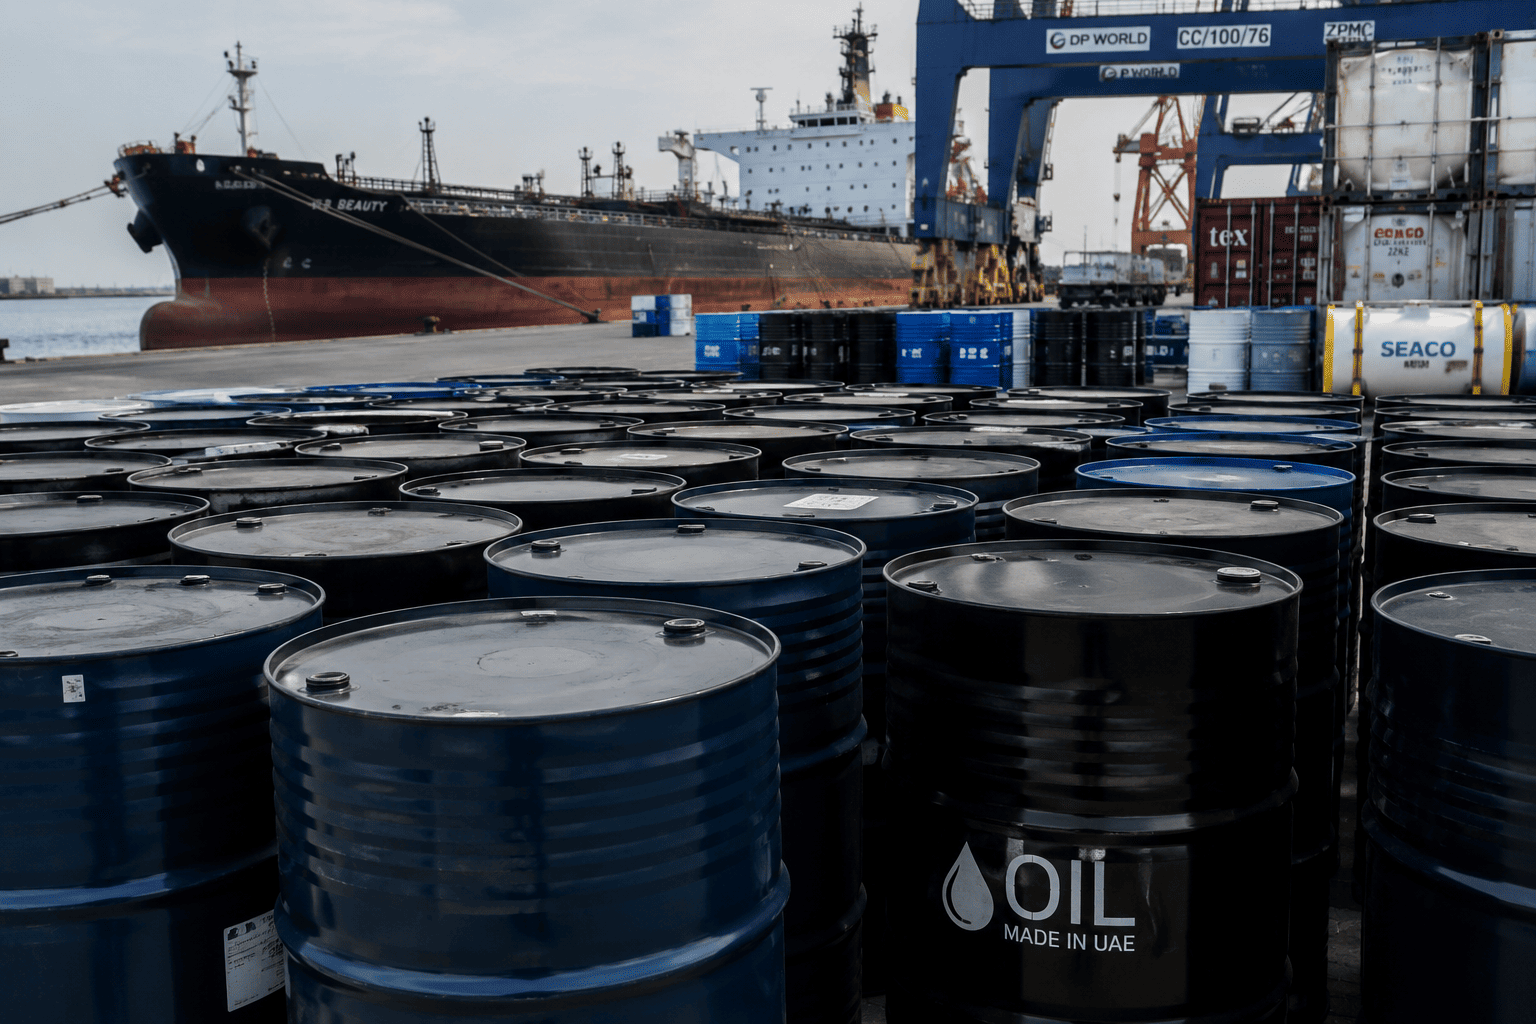
Adding to the uncertainty, President Donald Trump has indicated that the US-Iran conflict may not conclude until after the November midterm elections. This suggests that the Strait of Hormuz, a critical chokepoint for global oil shipments, could remain under threat, affecting millions of barrels daily.
Supply constraints and demand signals
Even before the pipeline attack, Saudi Arabia's oil exports had fallen to a nine-year low, with March exports at just 3 million barrels per day. Meanwhile, there are reports that Iran may be planning an "October surprise," potentially escalating attacks on US targets to influence the election outcome. Such actions could further disrupt supply chains.
On the demand side, China's oil imports are projected to rise by over 1.2 million barrels per day in the fourth quarter, adding to the supply squeeze. These factors have led analysts at Goldman Sachs to warn that oil could retest its year-to-date high of $120, with other institutions like Citi and Bank of America also raising their price forecasts.
Technical outlook: bullish pennant
From a technical perspective, Brent crude has rebounded significantly from its July low of $70.21, currently trading around $105.87. The price has broken above the key resistance level of $101.87, its highest point on July 23, and remains above the 50-day and 200-day exponential moving averages, indicating bullish momentum.
More notably, the daily chart shows the formation of a bullish pennant pattern, characterized by a sharp vertical move followed by a symmetrical triangle consolidation. This pattern often signals a continuation of the prior trend. If Brent breaks above the upper boundary of the triangle, the next target could be the $110 resistance level, with further upside potential toward $120.
However, traders should remain cautious, as geopolitical developments and unexpected supply changes could alter the trajectory. The market remains sensitive to news from the Middle East and global economic indicators.
For more on related market movements, see our coverage on Brent's recent surge and potential headwinds and the limits of Saudi Arabia's Plan B.
This article is for informational purposes only and does not constitute financial advice.