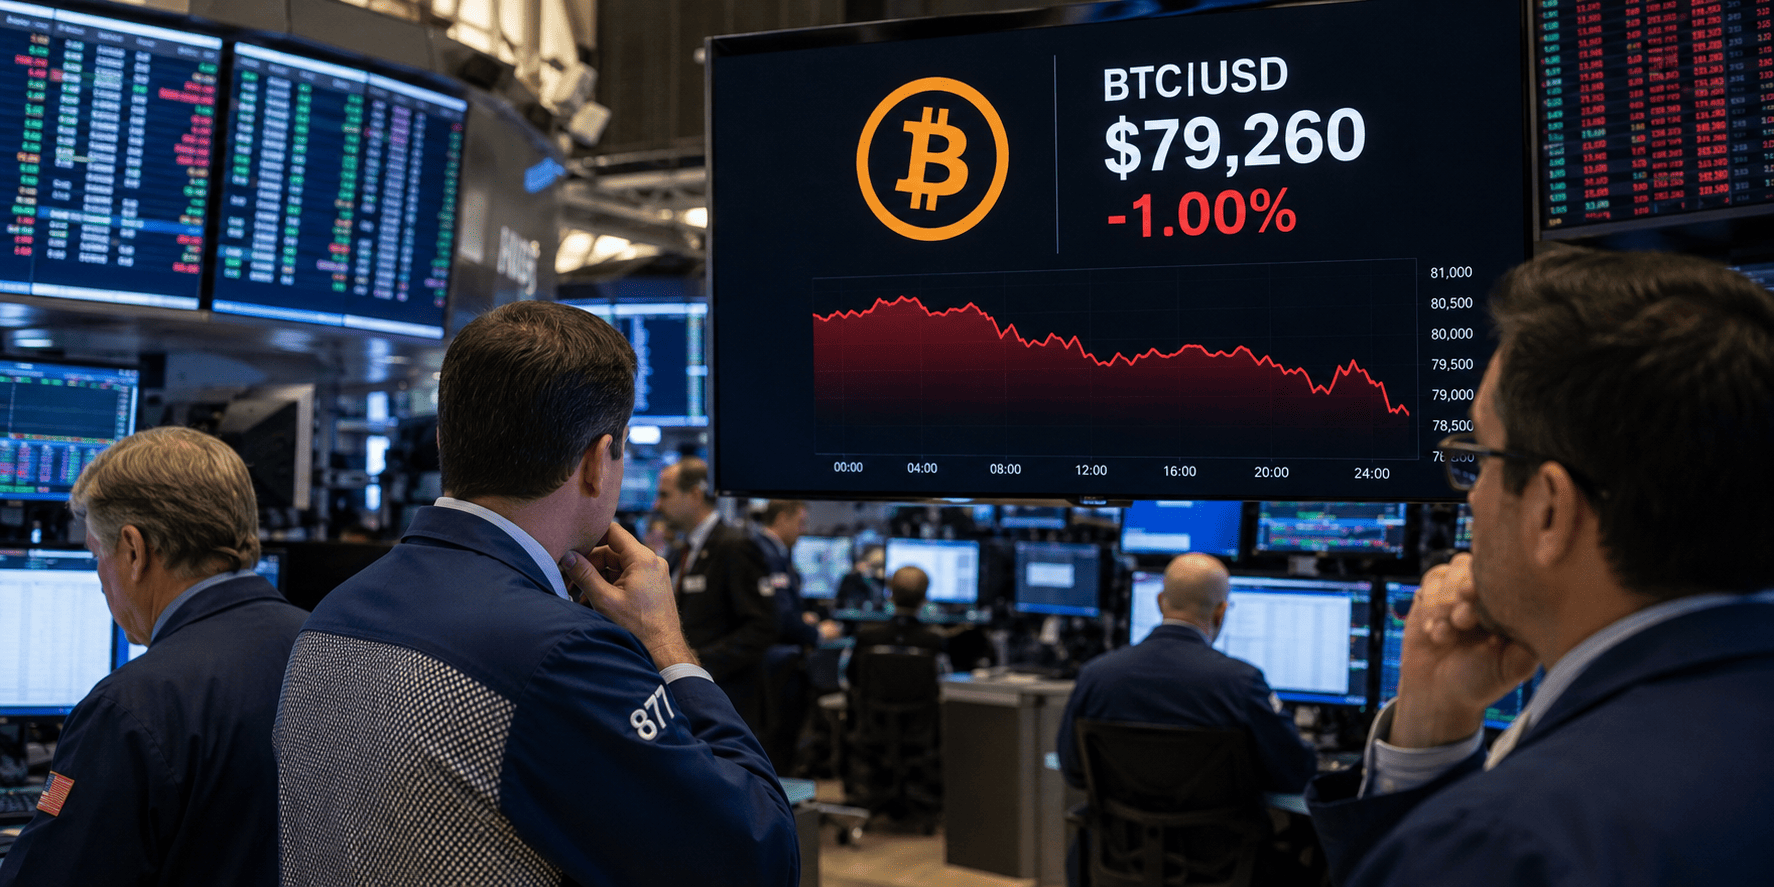
Bitcoin's price action has remained rangebound between $78,000 and $80,000 over the past few days, even as institutional demand via spot ETFs continues to surge. The leading cryptocurrency is currently trading around $79,300, down roughly 1% in the last 24 hours, after failing to hold above the 50-week simple moving average (SMA) at $81,114 earlier this week.
Spot Bitcoin ETFs have recorded $1.13 billion in net inflows between Monday and Thursday, according to SoSoValue, putting the funds on track for a second consecutive week of billion-dollar inflows. This sustained institutional buying suggests that large investors are rebuilding exposure to Bitcoin, yet the price has not responded with a decisive breakout. Analysts point to a key technical level that must be reclaimed to confirm a broader bullish shift.

Why is Bitcoin stuck below $80K?
Despite the strong ETF inflows, Bitcoin remains below its 365-day moving average near $83,000. Market observers consider a daily or weekly close above this level crucial for confirming a transition into a new bull-market phase. Until that happens, the price is likely to face resistance in the $80,000–$83,000 zone.
Data from CryptoQuant shows that apparent spot demand is increasing at its fastest monthly rate since late December, and spot and futures demand are expanding simultaneously for the first time since early October 2025. This suggests the rally is supported by broad market participation rather than just speculative futures activity. However, the lack of a clear breakout indicates that sellers are still active near current levels.
Macro backdrop: Fed speech and inflation data
Investors are now turning their attention to Federal Reserve Chair Kevin Warsh's speech at the Jackson Hole Symposium on Friday. Any hints about the future path of interest rates could trigger volatility across risk assets, including Bitcoin. A dovish tone might support further upside, while a hawkish stance could weigh on the cryptocurrency.
The latest US inflation data provided a mixed picture. The core Personal Consumption Expenditures (PCE) Price Index, the Fed's preferred inflation gauge, held steady at 3.3% year-over-year in July, matching expectations. On a monthly basis, both headline and core PCE rose 0.2%. Following the report, markets increased the implied probability of a September rate hike to 40%, up from 36% prior to the release. Higher interest rates typically strengthen the dollar and yields on traditional assets, which can reduce appetite for riskier investments like Bitcoin.
Technical outlook: key levels to watch
On the 4-hour chart, Bitcoin's momentum remains bearish despite the recent consolidation. The coin has lost about 2% since testing the 50-week SMA. If the weekly candle closes above this moving average on Sunday, it could bolster the bullish case and open the door for a move toward the next major resistance at $87,599, which aligns with the 100-week SMA at $89,017.
The 4-hour RSI sits at 71, indicating overbought conditions, but the weekly RSI at 58 remains in bullish territory. The MACD indicator has shown a bullish crossover since mid-July, with expanding green histogram bars suggesting positive momentum is still intact.
Should Bitcoin fail to break above its moving-average resistance and enter a deeper correction, the key psychological support at $70,000 could come into play. Buyers may step in at the 200-day EMA at $72,102, with additional support at the 50-day and 100-day EMAs at $68,713 and $68,369, respectively.
For context, other assets are also reacting to the macro environment. Gold has dipped below $4,600 ahead of the Fed speech, while Bitcoin slipped below $79K earlier this week, highlighting the sensitivity of risk assets to central bank signals.
As the market awaits Warsh's remarks, traders will be watching whether Bitcoin can finally break through the $80,000–$83,000 resistance zone. A sustained close above $83,000 would likely confirm a new bullish phase, while a failure could lead to a retest of lower supports.
This article is for informational purposes only and does not constitute financial advice.

