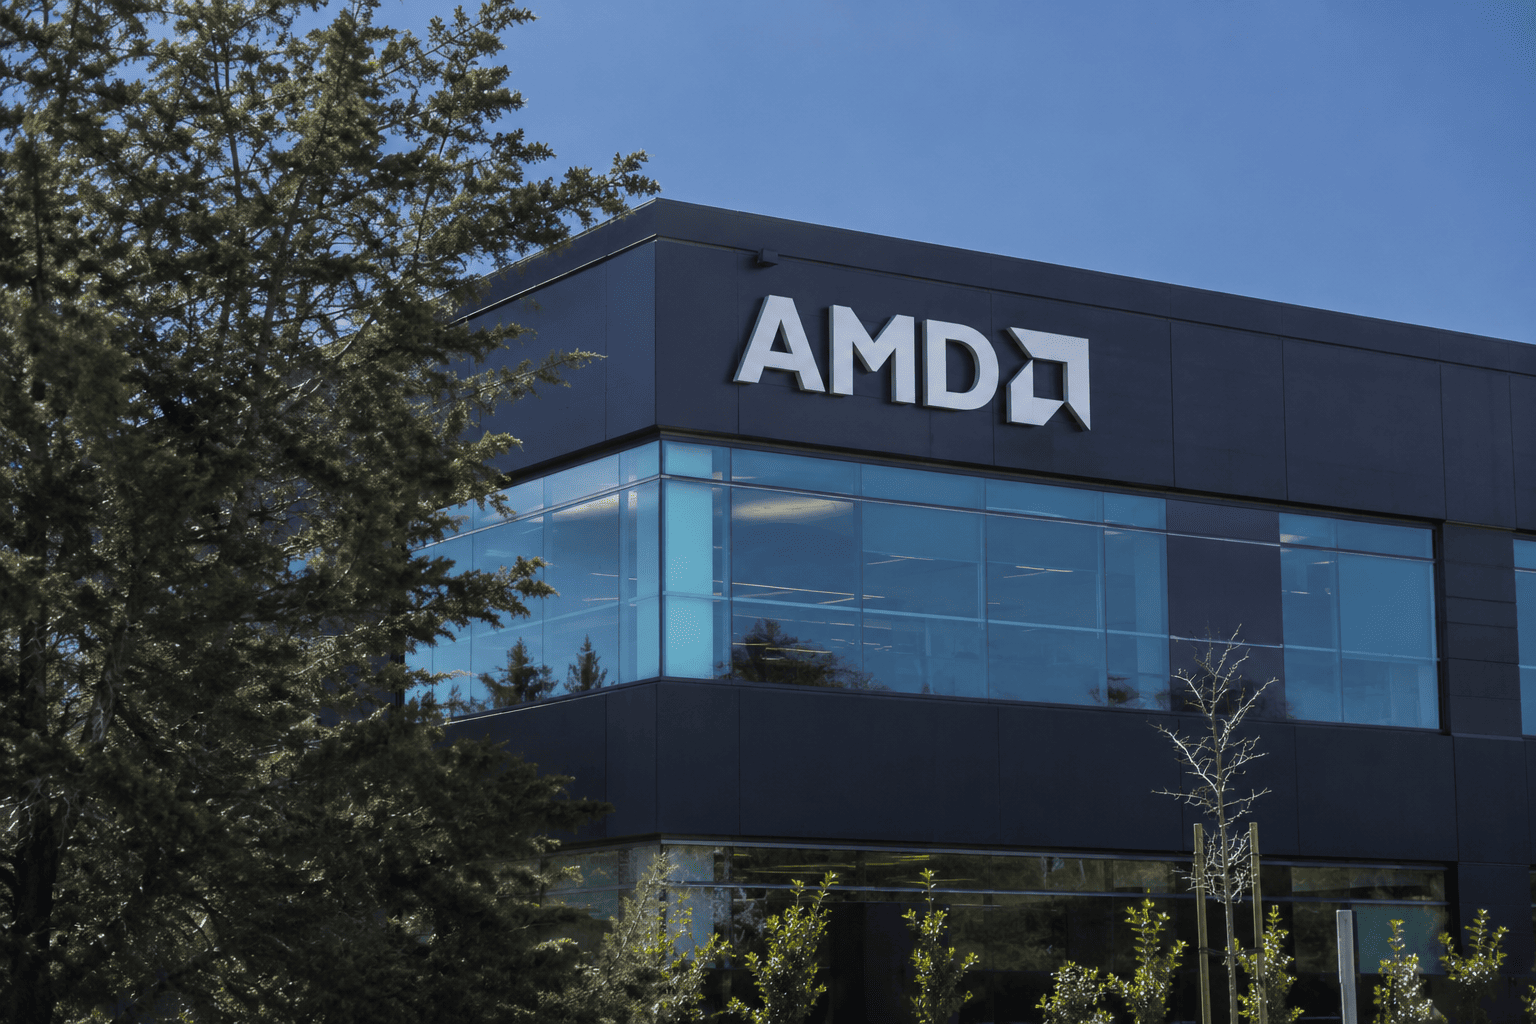
Advanced Micro Devices (AMD) shares have been consolidating near their yearly peak, with technical indicators pointing to further upside even as valuation metrics raise eyebrows. The stock traded around $514.40 on Monday, approaching the year-to-date high of $584, after the company detailed a $4.75 billion bond offering to finance its acquisition of ZT Systems, a prominent server maker.
Bullish technical setup
On the daily chart, AMD has formed a classic bullish flag pattern—a vertical rally followed by a downward-sloping consolidation channel. The price has climbed above the 50-day and 100-day exponential moving averages (EMAs), signaling a continuation of the uptrend. Additionally, the stock has broken above the Supertrend indicator and shows an inverted head-and-shoulders formation, another bullish reversal signal.

If the pattern plays out, the immediate target is the year-to-date high of $584. A decisive move above that level could open the door to the psychological $600 mark. However, traders should watch for a potential breakout failure, which could lead to a retest of support levels.
Strong business momentum
AMD's recent earnings underscore robust growth. In the second quarter, revenue surged 50% year-over-year to $11.5 billion, with the data center segment more than doubling to $6.7 billion. Embedded revenue grew 19% to $977 million, while the client and gaming segment contributed $3.8 billion. Operating income in the data center business skyrocketed by 1,457%.
The company raised its third-quarter guidance to approximately $13 billion, plus or minus $300 million, implying a 41% annual increase. Analysts are optimistic, with the most bullish revenue estimate at $14 billion and expected EPS of $1.93, up from $1.20 last year. Projections for the next two fiscal years point to revenues of $50 billion and $87 billion, respectively.
Valuation concerns persist
Despite the growth, AMD's valuation remains a sticking point. The stock trades at a forward non-GAAP price-to-earnings ratio of 68, far above the technology sector median of 24. Its GAAP multiple is even higher at 90. In comparison, Nvidia, which is growing faster, has a forward P/E of 25, while Marvell Technologies sits at 54.
Other multiples also appear stretched: forward EV-to-EBITDA is 61, and price-to-free cash flow is 106. A discounted cash flow (DCF) analysis suggests the stock is not undervalued, implying that AMD must deliver on its growth promises to justify the premium.
On the positive side, AMD is balancing growth with margin expansion. Its forward revenue growth is 40%, and net income margin is 15%, yielding a Rule-of-40 score of 55%, which is considered healthy, though that metric is typically used for software companies.
Investors may also want to monitor broader market trends, such as bitcoin's recent price action and Asian market technical patterns, which can influence sentiment. Additionally, Reddit's S&P 500 inclusion and ETF performance comparisons offer context for equity market dynamics.
In summary, AMD's technical setup suggests near-term upside, but the valuation overhang remains a key risk. The company's strong fundamentals and strategic moves like the ZT Systems acquisition provide a foundation, yet investors should weigh the premium price against potential growth.
This article is for informational purposes only and does not constitute financial advice.