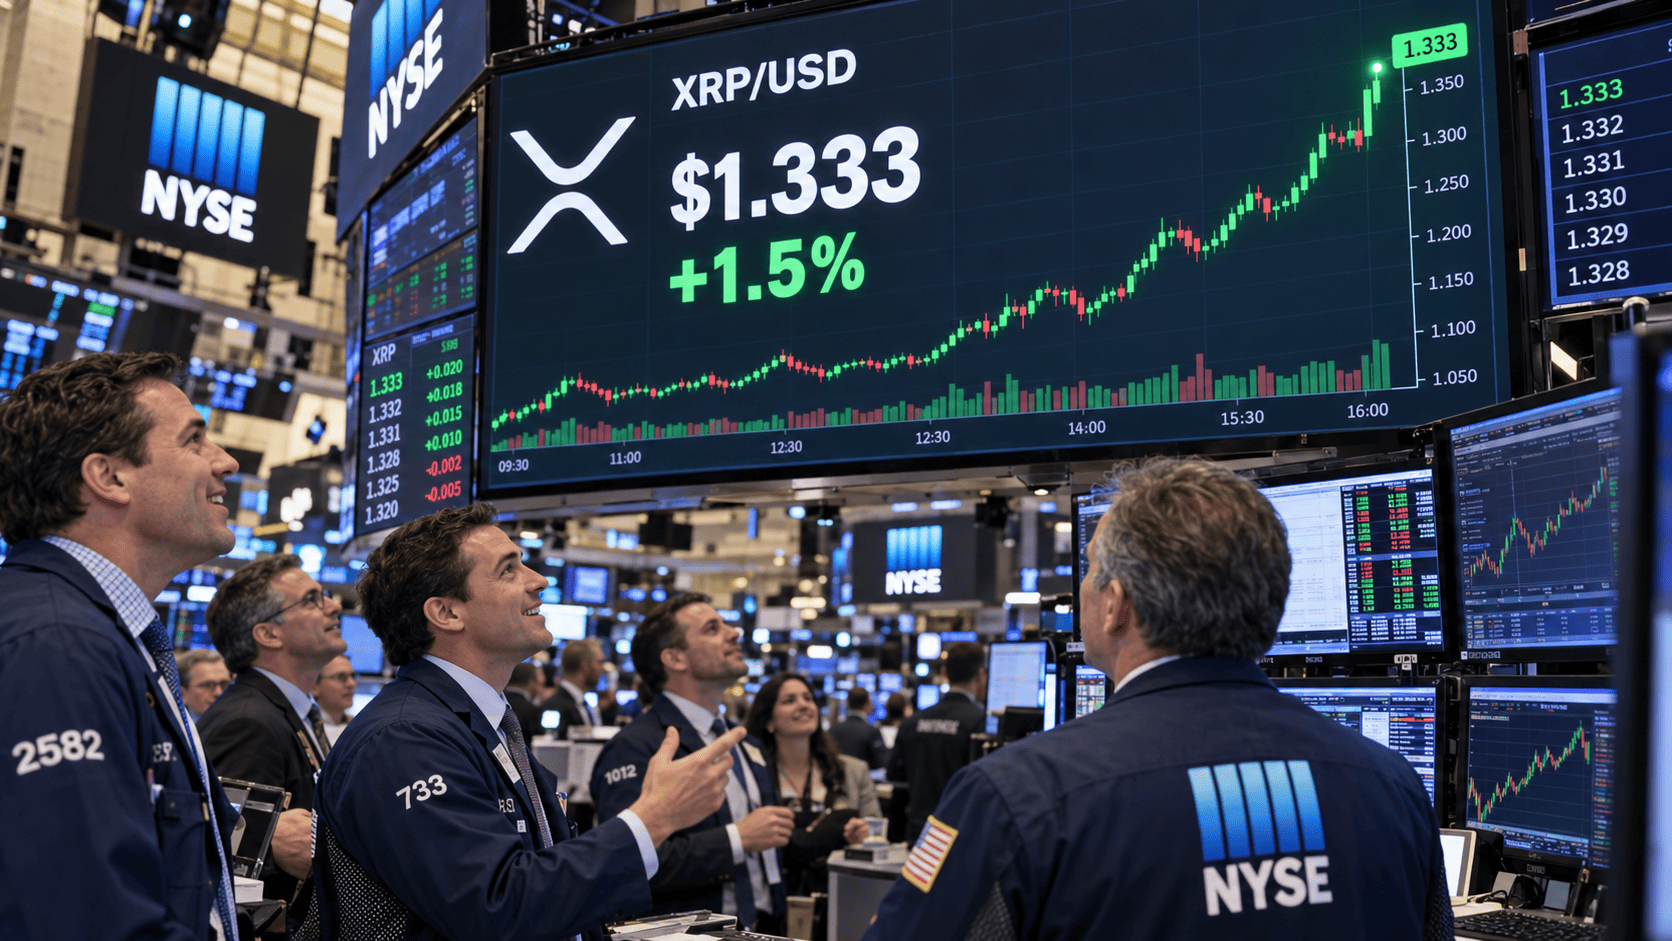
XRP has climbed 1.5% over the past 24 hours to trade near $1.37, recovering from a low of $1.31. The rebound comes as the Bank for International Settlements (BIS) published a proof-of-concept test using the XRP Ledger, and as US spot XRP ETFs recorded their 11th consecutive day of net inflows.
BIS Test Adds Institutional Credibility
In a working paper released on September 2, BIS researchers detailed a system that uses the XRP Ledger to verify official statistical datasets. The proof of concept involved creating cryptographic fingerprints of datasets and storing a summary value on the ledger, allowing users to confirm the publisher's identity and detect any post-publication alterations. Only the fingerprints were placed on-chain, keeping the underlying data off the ledger. The test, conducted on XRPL Devnet, showed publishing times of three to five seconds and verification times of one to two seconds, with batching enabling a single ledger entry to cover thousands of datasets.

It is important to note that BIS has not adopted the XRP Ledger for any production system. The experiment remains a proof of concept, but it provides a fresh narrative for XRP traders focused on institutional use cases.
ETF Inflows Persist
Demand for US spot XRP ETFs has remained steady. According to SoSoValue, these products saw another $14.38 million in net inflows on September 1, extending the streak to 11 sessions. Cumulative inflows during this period have reached roughly $170 million, bringing total inflows since the ETFs launched in November to approximately $1.68 billion. Investors continued adding exposure even as XRP pulled back from its late-August highs.
On-Chain Demand Zone and Escrow Dynamics
XRP has returned to a significant on-chain demand area. More than 4.8 billion XRP were previously acquired between $1.31 and $1.38, and the token bounced after briefly touching the lower end of that range. A move above $1.38 would place XRP above the upper boundary, with the next resistance area near $1.60 based on historical transaction activity.
Selling pressure from Ripple's September escrow unlock has been limited. Ripple unlocked 1 billion XRP on September 1 but re-locked 700 million into new escrow contracts, leaving only 300 million outside the new locks. This reduces the amount of XRP that could potentially enter the liquid supply, easing concerns about a full 1 billion token release.
Technical Levels to Watch
On the daily chart, XRP is trading near $1.37 after a sharp August rally from below $1.00 to the $1.50 area. The token has since pulled back but remains well above the lower Donchian Channel boundary at $0.9928. The upper boundary of the 21-day Donchian Channel sits at $1.5201, making $1.52 the first major level to clear for an extension of the August breakout. XRP is currently about 11% below that level. A daily close above $1.52 would open the door to the $1.60 resistance zone.
The daily Money Flow Index (MFI) has dropped from above 80 during the August spike to 44.62, now below the neutral 50 level as trading volume has declined. A recovery above 50, combined with a move through $1.38, would signal returning buying pressure. Conversely, a continued slide toward 30 would increase the likelihood of another test of $1.31.
On the 4-hour chart, XRP has been consolidating between roughly $1.34 and $1.40 after retreating from the late-August peak. Recent candles have stopped making steep lower lows, with price recovering from around $1.34 to $1.37 on September 3. The Aroon indicator shows Aroon Up at 80% and Aroon Down at 16%, favoring recent highs, though Aroon Up has started to fall from 100%. XRP needs to push back through $1.40 and hold above it to keep the indicator weighted toward recent highs.
The 4-hour Chande Momentum Oscillator has recovered to 18.45 after dipping below zero to around -70. Moving back into positive territory indicates that recent gains now outweigh recent losses. A continued rise toward 50, alongside a break above $1.40, would support a move toward the late-August resistance between $1.50 and $1.52.
Failure to clear $1.38-$1.40 would keep XRP within its current consolidation range. A break below roughly $1.34 would expose the recent $1.31 low, and losing the $1.31 demand area would bring the next visible support on the daily chart into focus around $1.25-$1.26.
For broader context, XRP's recent slide and the importance of the $1.35 level have been key themes. Meanwhile, Bitcoin ETFs also saw inflows but faced similar resistance, highlighting a broader trend in digital asset markets.
This article is for informational purposes only and does not constitute financial advice.