
XRP is trading in the red on Tuesday, extending a modest pullback after last week's double-digit correction. The altcoin slipped nearly 1% over the past 24 hours, underperforming the broader crypto market, which is also slightly lower following a strong rally last week. Bitcoin, for instance, has dipped below $78,000.
Despite the price weakness, institutional interest in XRP remains robust. Spot XRP exchange-traded funds recorded $5.64 million in net inflows on Monday, marking the tenth consecutive trading day of positive flows since August 18, according to CoinGlass. Last week's inflows totaled more than $110 million, the strongest weekly performance since early December 2025.
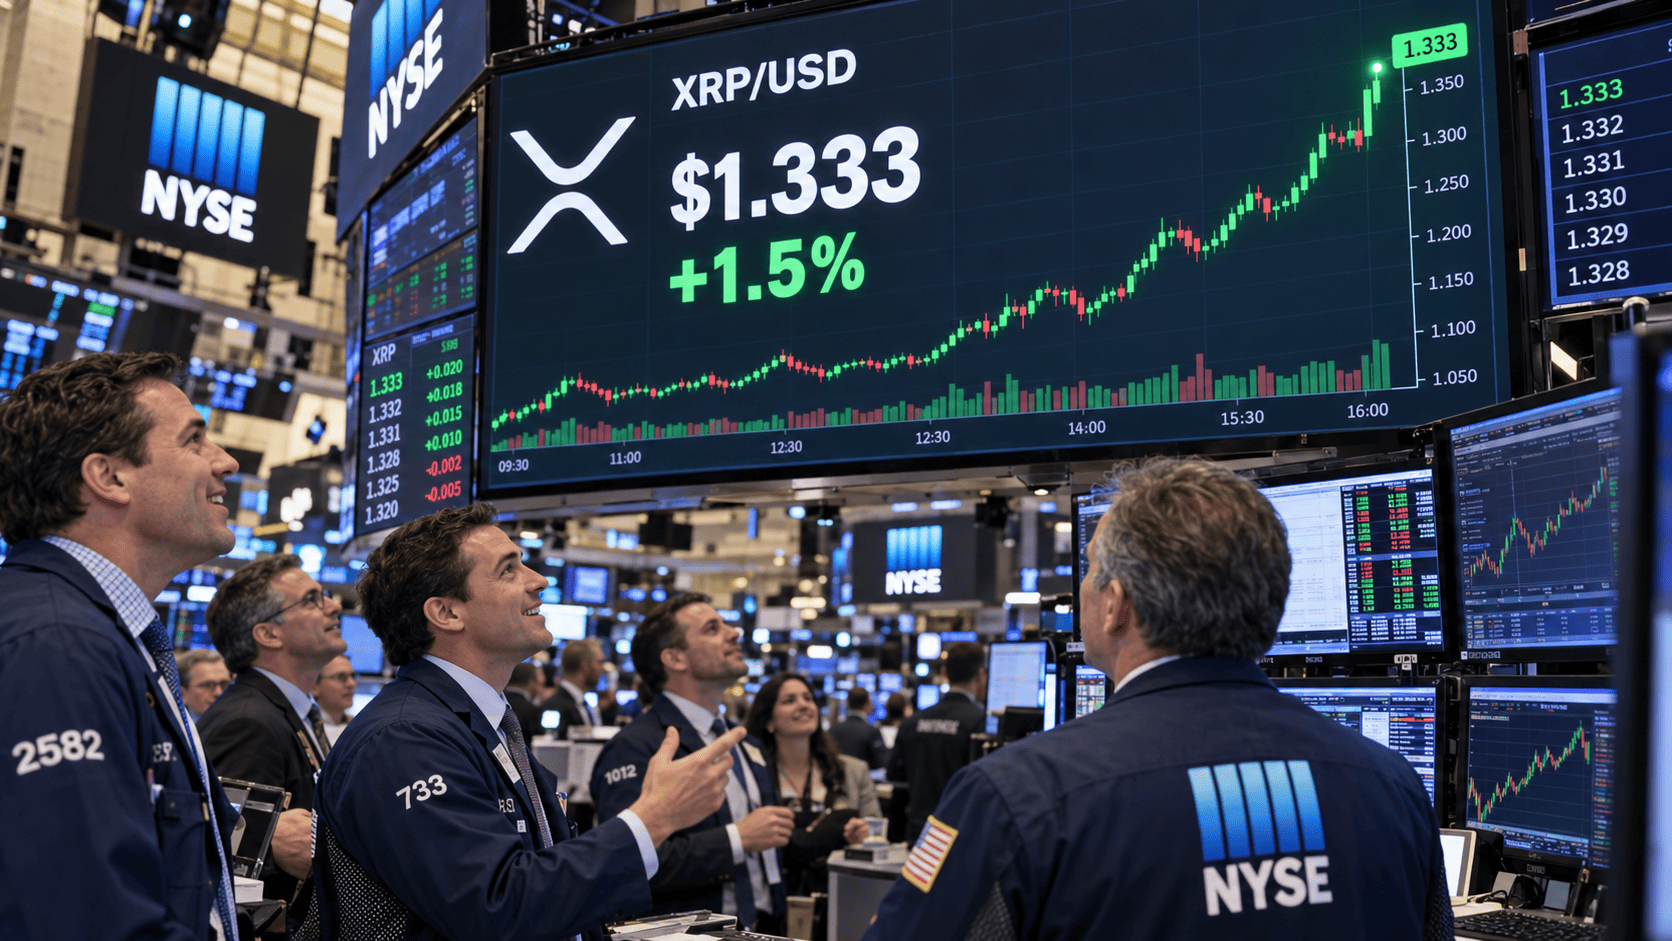
Continued ETF inflows could tighten available supply and bolster demand, providing a supportive backdrop for a potential recovery. If institutional investment accelerates further, it may add meaningful momentum to XRP's price action.
Technical picture: XRP holds above key moving averages
On the 4-hour chart, XRP/USD remains in a cautiously bullish configuration despite the recent consolidation. The token is trading around $1.36, staying above several important exponential moving averages (EMAs). The 200-day EMA at $1.35 serves as immediate support, while the 50-day and 100-day EMAs, both near $1.21, reinforce a broader demand zone below.
Holding above these levels suggests the underlying trend is still constructive, even after the pullback from overbought conditions. The Relative Strength Index (RSI) has cooled to 44, down from extreme readings, indicating fading buying pressure but not yet a bearish reversal. The Moving Average Convergence Divergence (MACD) has slipped into negative territory, signaling weakening upside momentum, though the broader outlook remains positive as long as XRP defends its 200-day EMA.
Key levels to watch
If buying pressure resumes, XRP could target the horizontal resistance at $1.90. That area may attract sellers, making it the next major hurdle for an extended rally. On the downside, immediate support sits at the 200-day EMA near $1.35. A daily close below that could expose the horizontal support at $1.30, with the 50-day and 100-day EMAs near $1.21 as the next line of defense. Below that, $1.00 represents the next major structural support.
XRP's ability to hold $1.35, combined with sustained ETF inflows, will likely determine whether the current rebound evolves into a broader recovery. Similar dynamics are playing out in other digital assets; for instance, Ethereum holds $2,450 as ETF inflows offset Fed rate worries, and Bitcoin ETFs see $1.13B inflows but BTC stays below $80K, highlighting the mixed signals across the market.
Investors are also keeping an eye on macro factors, as Bitcoin slips below $78K as Fed rate hike odds climb to 57%, which could influence risk appetite. Meanwhile, Trade Desk stock shows bullish signals despite weak earnings, underscoring that technical resilience can sometimes outweigh near-term headwinds.
This article is for informational purposes only and does not constitute financial advice.