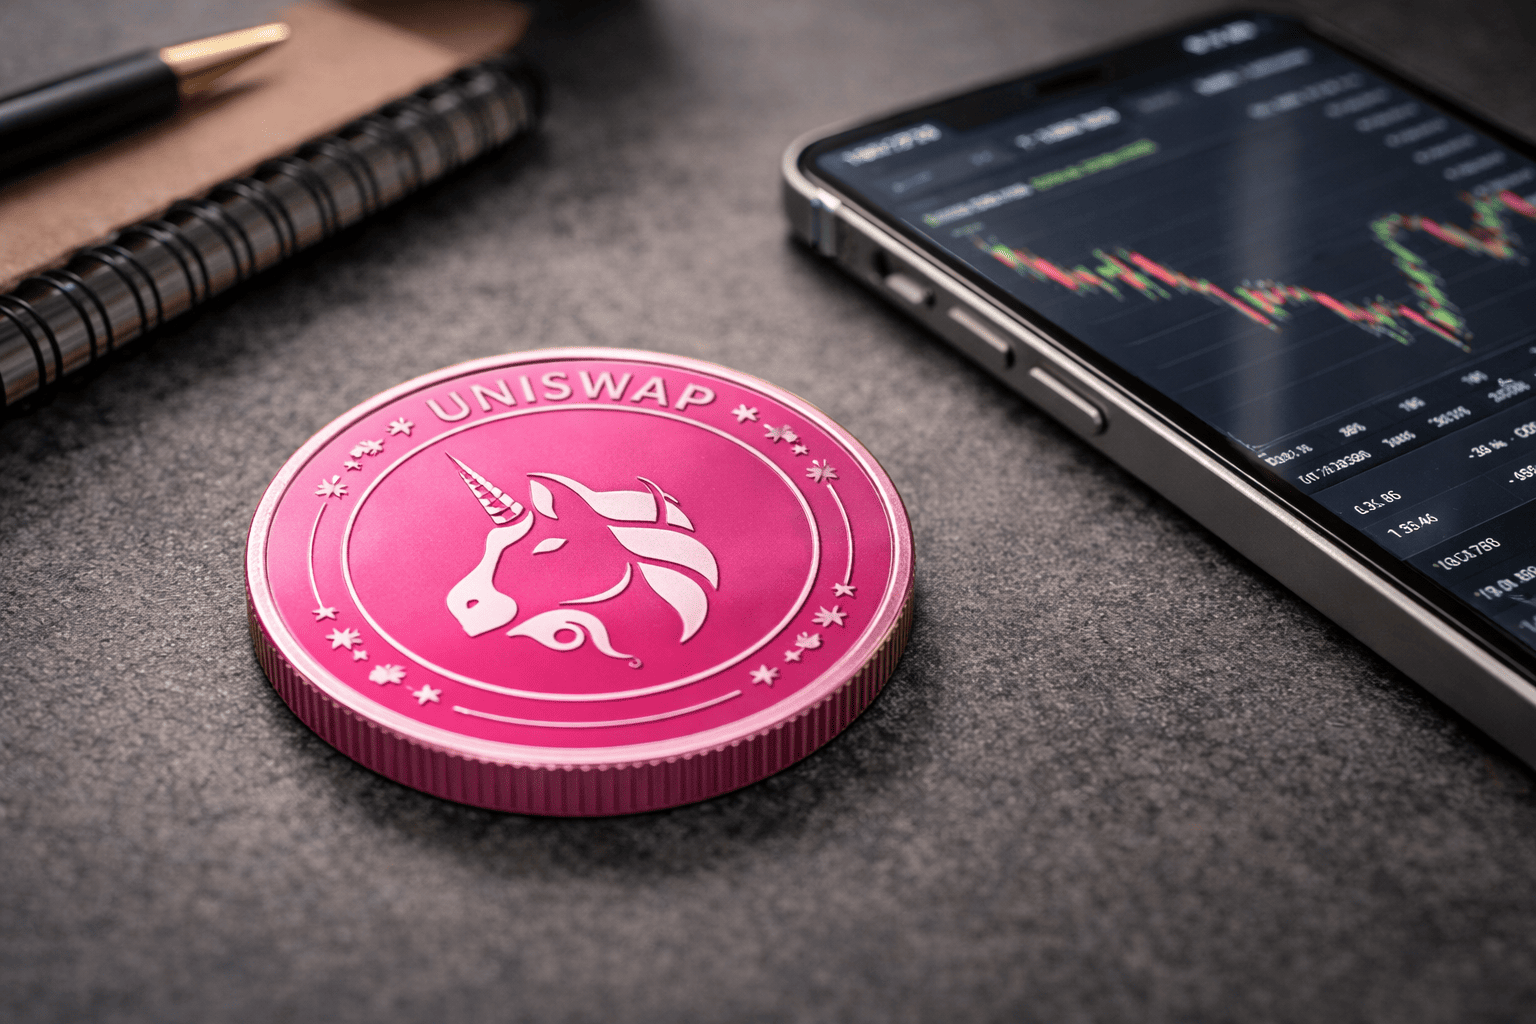
Uniswap's UNI token has retreated to around $9.54 after briefly touching $11 on Sept. 23, leaving the cryptocurrency up roughly 5% over the past 24 hours and more than 50% over the last seven days. The pullback follows a sharp rally that saw UNI climb from near $6 on Sept. 17 to an intraday high of approximately $10.90 before sellers stepped in.
According to CoinGecko data, UNI has gained 51.5% over the past week and 121.6% over the last 30 days, despite the recent dip. Trading volume reached about $2.43 billion in the previous 24-hour session, and UNI's weekly performance has outpaced Bitcoin's over the same period.

CME Futures Launch Provides Catalyst
The clearest catalyst for the latest leg of the rally is CME Group's announcement on Sept. 22 that it will introduce regulated Uniswap futures, scheduled to launch on Oct. 19, subject to regulatory review. The standard contract will represent 10,000 UNI, while the Micro UNI futures will cover 1,000 UNI, giving professional and institutional traders a regulated avenue for exposure or hedging.
UNI moved higher following the announcement and continued climbing on Sept. 23 before encountering resistance near $11. The price reached the $10.80 to $10.90 zone before falling back below $10.
Derivatives Positioning and Protocol Fees
Derivatives positioning has risen alongside the spot market. UNI futures open interest was near $971 million as the token tested the $11 area, indicating that leveraged positions had grown during the move. Higher leverage can amplify price swings in either direction if traders begin closing positions or face liquidations.
Uniswap's protocol fee mechanism, active since December 2025, provides another fundamental driver. The mechanism uses collected protocol fees to permanently burn UNI rather than distributing revenue directly to token holders, according to Uniswap's documentation. Governance participants are now considering extending protocol fees to Arc, Circle's Layer 1 network, where Uniswap v2, v3, v4, and UniswapX were deployed at launch. The current proposal would activate protocol fees and UNI burns from activity on Arc. Voting on the Snapshot proposal runs from Sept. 18 through Sept. 23 before a possible on-chain vote.
Protocol usage has remained active during the price move. CoinGecko figures showed Uniswap generating around $4.07 million in fees over 24 hours and roughly $442,000 in protocol revenue.
Technical Levels to Watch
On the 4-hour chart, UNI's rejection from $10.80 to $10.90 has brought the price back to around $9.54, but the structure that preceded the breakout has not yet been lost. The Parabolic SAR sits at $9.39, just below the current price. UNI remaining above the indicator keeps the 4-hour trend intact for now, while a sustained move below $9.39 would signal that the pullback from $11 is gaining ground.
Aroon gives a similar reading. Aroon Up stands at 88% against Aroon Down at 12%, showing that recent highs still dominate the 4-hour trend despite the latest red candles. Aroon Up falling while Aroon Down rises would weaken that signal, particularly if UNI loses $9.39 at the same time.
The $9 area provides the next visible support if $9.39 fails. UNI spent several sessions consolidating between roughly $8.60 and $9.20 before breaking higher on Sept. 23, making the former consolidation zone relevant if sellers continue to push the price lower.
On the daily chart, UNI remains well above the Ichimoku cloud. The Tenkan-sen is near $8.47, and the Kijun-sen sits around $7.65, while the upper portion of the projected cloud is close to $8.06. Price trading above each of those levels keeps the larger trend pointed higher despite the rejection near $11.
Chaikin Money Flow remains positive at 0.05. The reading has cooled from levels close to 0.30 seen around the end of August, but it has not fallen below zero, indicating that buying pressure has not completely given way to selling pressure.
A recovery above $10 would put the $10.80 to $11 zone back in focus. A daily close above $11 would clear the latest rejection high and could open a move towards $12, with the level serving as the next major psychological target visible above the current range. Failure to hold the 4-hour Parabolic SAR level around $9.39 would instead expose $9, followed by the daily Tenkan-sen near $8.47. A break below $8.47 would weaken the current daily structure and bring the $8.00 to $8.06 region around the projected Ichimoku cloud into focus.
This article is for informational purposes only and does not constitute financial advice.

