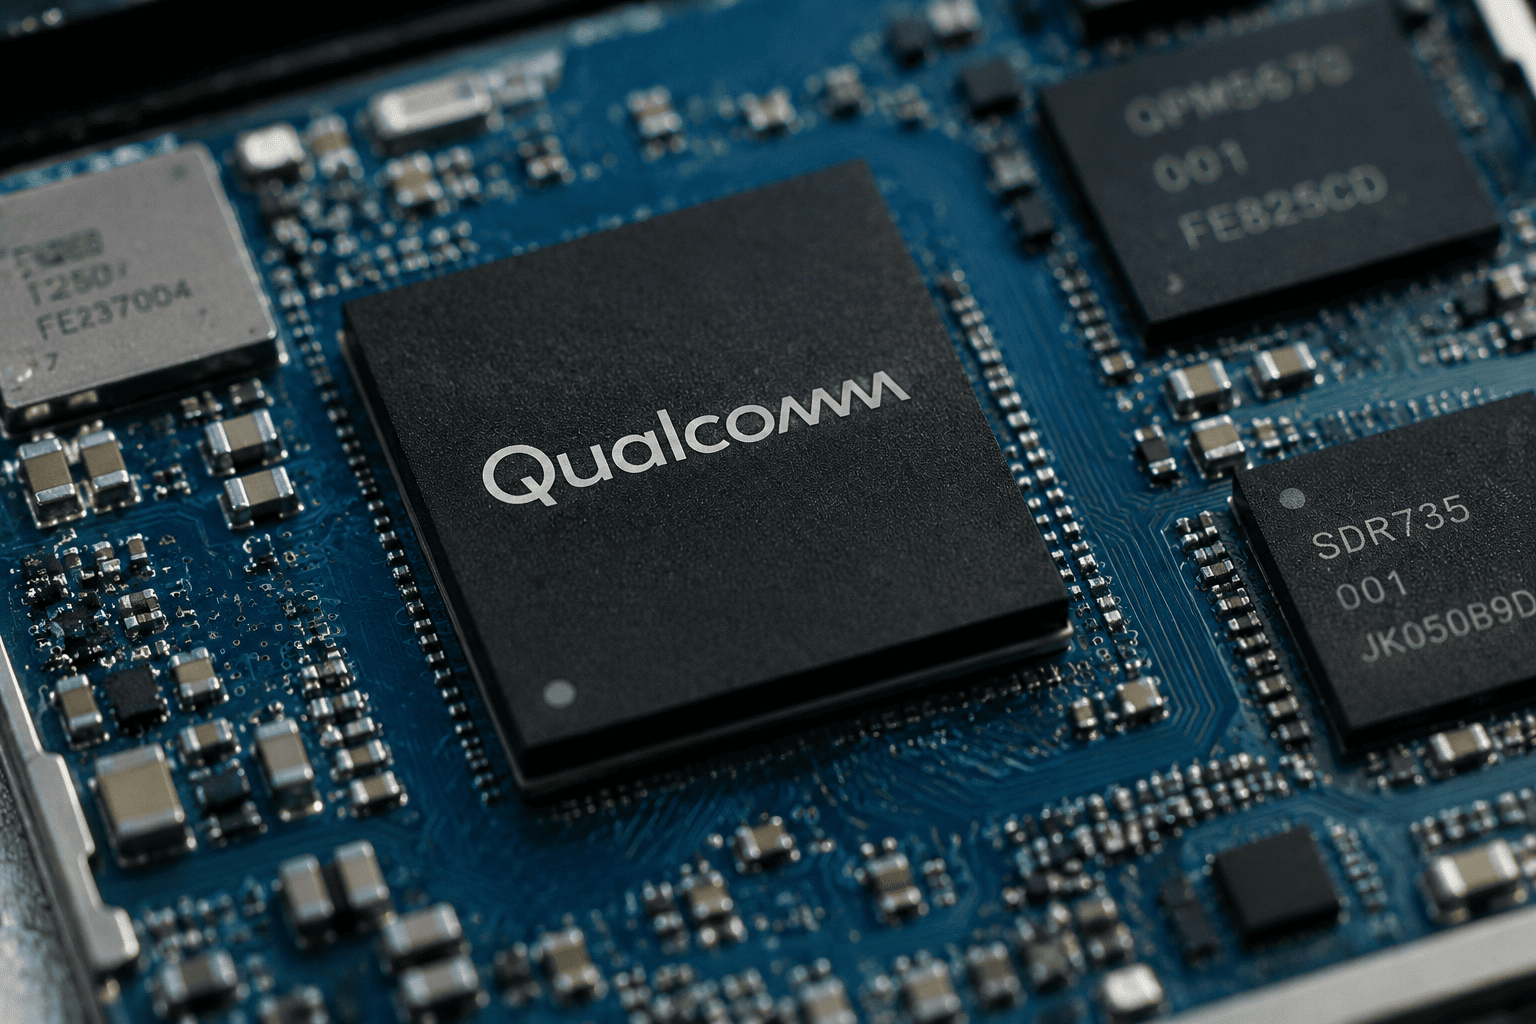
Qualcomm (QCOM) shares have extended their decline, hitting the lowest level since late April as the broader semiconductor sell-off intensifies. The stock has lost more than 37% from its 2024 peak, with market capitalization shrinking from $265 billion to $171 billion. The VanEck Semiconductor ETF (SMH) has dropped from $671 to $529, while the iShares PHLX SOX Semiconductor Sector ETF (SOXX) has fallen from $655 to $490.
Earnings Preview and Price Hike Strategy
Qualcomm is set to report quarterly results amid expectations of a 6.68% year-over-year revenue decline to $9.6 billion. Earnings per share are forecast to fall from $2.77 to $2.22. To counter revenue weakness, the company plans to raise prices on all chips shipping from September, citing an inability to absorb supplier cost increases and limited alternative sourcing options.

Analysts project full-year revenue of $42.6 billion, down 3.5% from the prior year, with a recovery to $44.18 billion expected next year. However, the risk of higher prices dampening smartphone and device demand remains a concern.
Valuation and Options Market Signals
Despite the sell-off, Qualcomm's forward price-to-earnings ratio stands at 15, well below the sector median of 23. The SOXX ETF carries a P/E of 67. Qualcomm's forward price-to-cash flow ratio of 12.90 also trails the sector median of 18.7, suggesting the stock may be undervalued relative to peers.
The options market is pricing in significant post-earnings movement, with implied volatility surging to 123%. The put/call open interest ratio has dropped to 0.55, indicating that more traders are positioning for upside rather than downside. This aligns with recent patterns seen in other tech names ahead of earnings, such as Meta's options signaling a rally despite capex concerns.
Technical Analysis Points to Volatility
From a technical perspective, Qualcomm's chart shows a falling wedge pattern—a formation often associated with bullish breakouts. However, the Percentage Price Oscillator (PPO) continues to trend lower, and the Relative Strength Index (RSI) is approaching oversold territory near 30, suggesting further downside may be needed before a reversal.
Key levels to watch are $150 on the downside and $180 on the upside. A break below $150 could accelerate selling, while a move above $180 would signal a potential trend change. The broader market context, including the recent Dow's 450-point plunge amid Fed and chip rout, adds to the uncertainty.
Investors should note that the options market's elevated implied volatility and the falling wedge pattern both point to a high-probability move after earnings, but the direction remains uncertain. The stock's low valuation relative to the sector may provide a floor, but the price hike strategy and demand risks could cap upside.
This article is for informational purposes only and does not constitute financial advice.