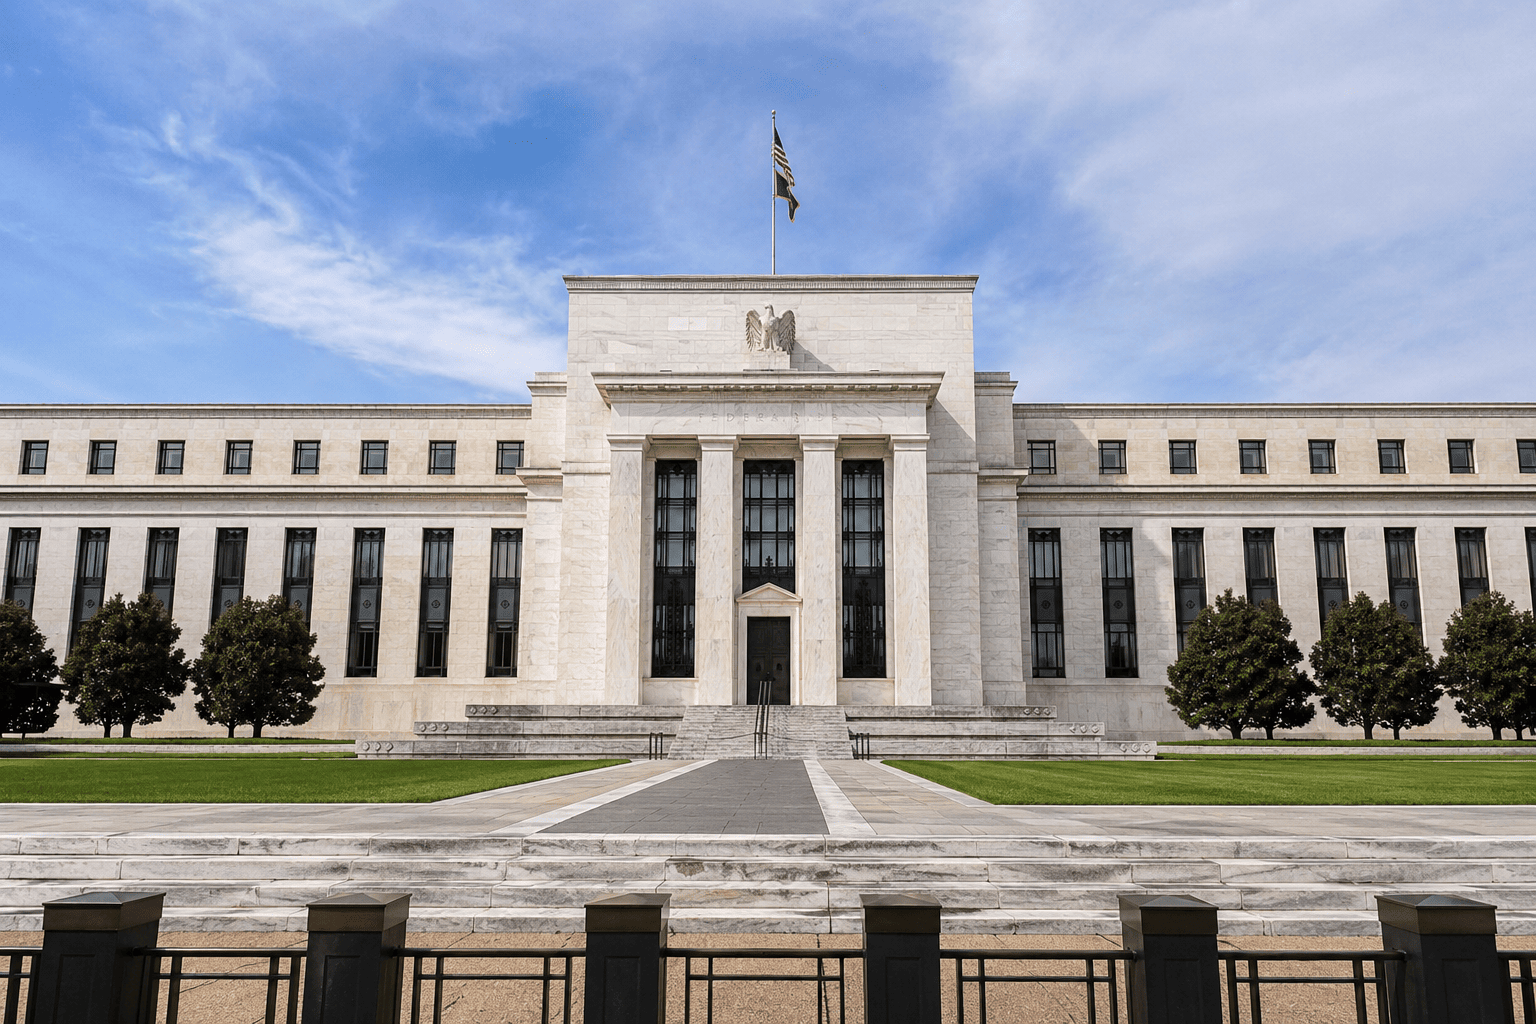
Copper futures are trading in a narrow band as market participants await the Federal Reserve's policy decision and the latest US inflation data. The red metal has found support from improved Chinese economic figures and a pullback in the US dollar, but persistent inflation concerns and global economic uncertainties are limiting upside momentum. At the time of writing, Comex copper futures were at $6.58 per pound, up 0.12% on the day.
Chinese demand optimism and dollar weakness underpin copper
Recent data from China, the world's largest copper consumer, have bolstered sentiment. Industrial production rose 5.5% year-over-year in September, up from 5.2% in August and above the 5.4% consensus forecast. Additionally, the country's GDP expanded 4.5% in the third quarter, accelerating from 4.3% in the prior quarter, which had been the slowest pace since 2022. The recovery was partly driven by an AI export boom, though persistent property market weakness and low consumer confidence continue to weigh on the economy.

The US dollar has eased from an 18-month high reached about a week ago. A softer dollar typically supports copper by making it cheaper for holders of other currencies, thereby boosting demand.
Fed meeting and PCE data in focus
Investors are now turning their attention to the Federal Reserve's October meeting and the release of the Personal Consumption Expenditures (PCE) price index later this week. While the Fed is widely expected to keep interest rates unchanged at this meeting, markets are pricing in a possible hike in December. The tone of the Fed Chair's remarks will be closely scrutinized for clues on future policy. As copper is often seen as a bellwether for global economic health, any signals of persistent inflation could weigh on the metal.
Technical outlook: range-bound with key levels to watch
On the daily chart, copper is trading below the short-term 25-day exponential moving average (EMA) but hovering near the 50-day EMA. The bullish golden cross formed in mid-April remains intact, suggesting underlying support. The relative strength index (RSI) stands at 46, indicating neutral to slightly bearish momentum.
The immediate trading range is defined by the 25-day EMA at $6.62 on the upside and support at $6.52 on the downside. A break below this range could see copper test the $6.49 level, where buyers may step in to defend the longer-term trendline. On the upside, a move above $6.65 would open the door to the next resistance at $6.71.
Given the mixed signals from fundamentals and technicals, copper appears poised for continued consolidation until clearer direction emerges from the Fed and inflation data. Traders should monitor these events closely for potential volatility.
This article is for informational purposes only and does not constitute financial advice.