BNB (formerly Binance Coin) extended its decline on Friday, trading below $575 and posting a weekly loss of nearly 4%. The token remains under pressure from weak institutional participation, rising short positioning, and declining futures activity, reinforcing a bearish short-term outlook.
Weak Institutional Demand Weighs on Price
Data from SoSoValue shows that BNB spot ETF products have recorded minimal activity since their launch on May 28. The absence of meaningful inflows suggests that institutional investors are not yet providing sustained demand for the asset. This lack of participation reduces potential downside protection and leaves BNB more exposed to broader market selling pressure.

Similar dynamics have been observed in other crypto assets, as highlighted in our coverage of Cardano Bearish Pressure Intensifies as Derivatives and On-Chain Data Weaken.
Derivatives Market Signals Bearish Bias
BNB’s derivatives market continues to weaken, reinforcing expectations of further downside. Futures Open Interest (OI) fell to approximately $865.53 million on Friday. Although there was a brief recovery in early June, OI has been steadily declining since mid-January, indicating reduced trader engagement and weakening conviction in the market.
Sentiment data further confirms this trend. CoinGlass reports a long-to-short ratio of 0.88, its lowest level in over a month. A reading below 1 indicates that short positions outweigh longs, reflecting a clear bearish bias among traders. The combination of bearish derivatives data and minimal institutional participation could allow bears to push BNB’s price toward lower support levels in the near term.
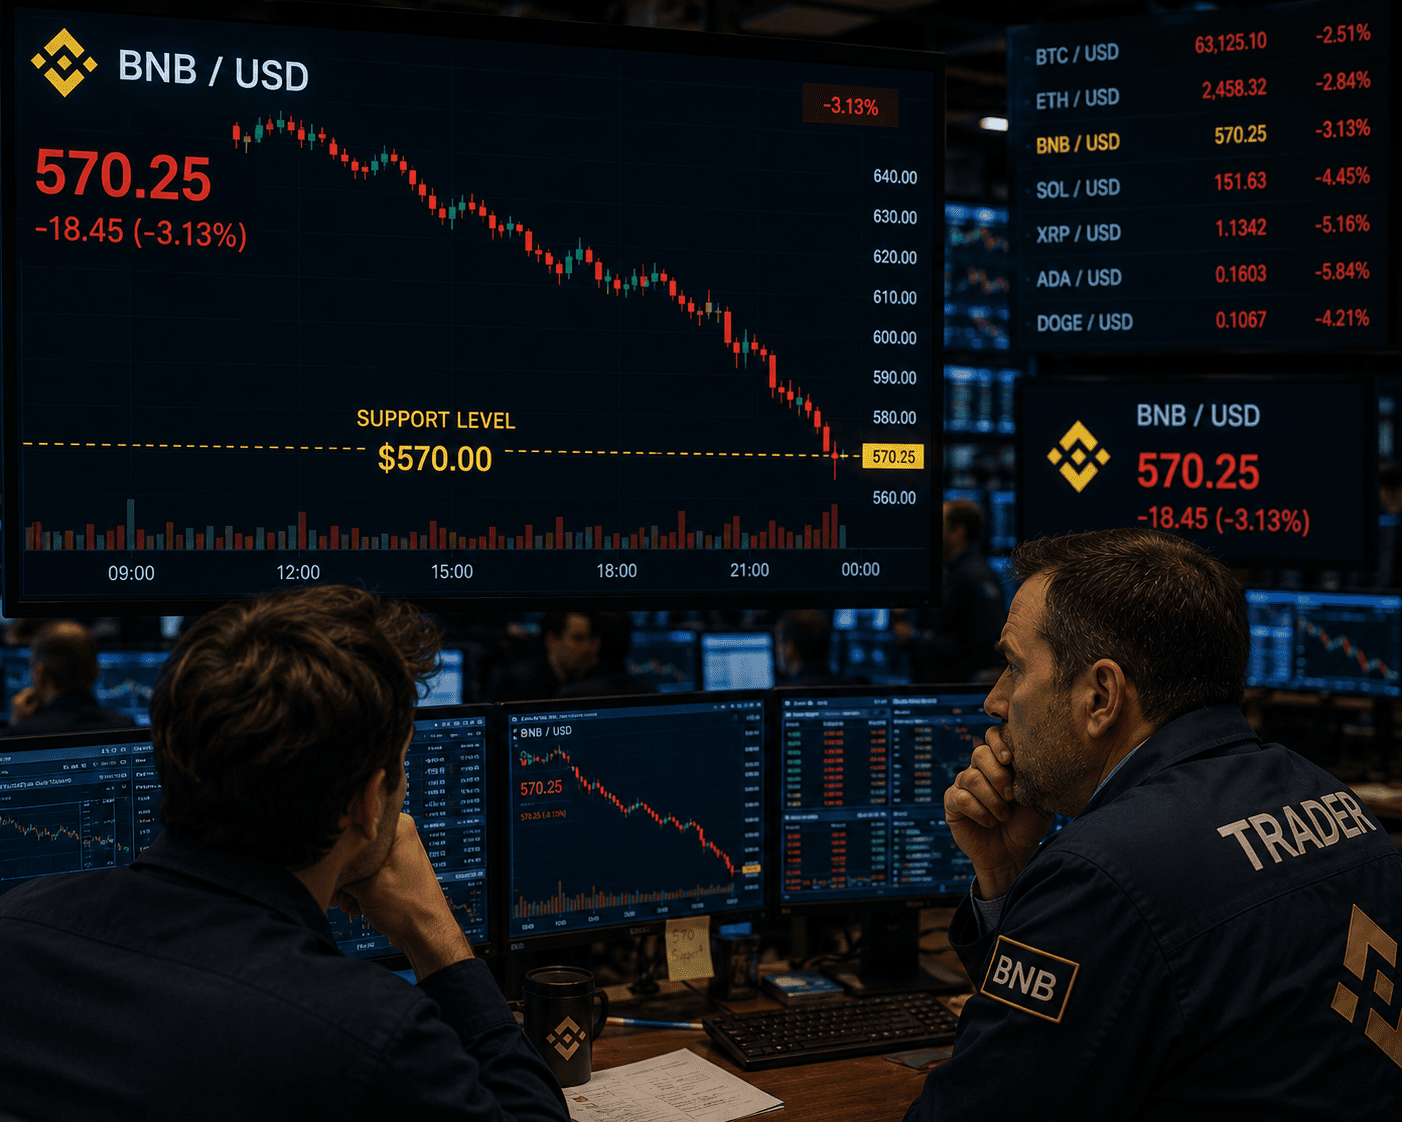
Technical Analysis: $570 Support in Focus
The BNB/USD 4-hour chart remains bearish. BNB is currently trading at $573, extending its bearish momentum after rejection from the 50-day Exponential Moving Average (EMA) at $625.24 earlier in the week. The coin is now testing the psychological support level at $570. A decisive daily close below this level could accelerate losses, with a projected downside target around $488.
Momentum indicators continue to favor sellers. The Relative Strength Index (RSI) remains in the mid-30s, signaling weak momentum but not yet a confirmed reversal. Meanwhile, the Moving Average Convergence Divergence (MACD) remains in negative territory, suggesting that bearish control is still dominant.
If buyers attempt a rebound, immediate resistance is expected at the 50-day EMA near $625.24. Above that, further barriers appear at the 100-day EMA at $645.88 and the 23.6% Fibonacci retracement at $662.04. Stronger recovery momentum would be required to challenge the upper boundary of the resistance region near $687.30 and the 200-day EMA at $691.91.
A decisive candle close above these levels could pave the way for BNB to extend its rally in the medium term, with additional resistance levels at $718.89, $764.84, $810.78, $876.20, and $959.52. However, BNB’s price action could remain bearish in the near term, with other major cryptocurrencies like Bitcoin and Ethereum also underperforming. For context, see our analysis of XRP Faces $1.05 Retest Risk as Price Stalls Below Key Moving Averages.
Investors should also monitor broader market trends, such as Micron Earnings to Gauge AI Chip Demand as S&P 500 Holds Near Records, which could influence risk appetite across asset classes.
This article is for informational purposes only and does not constitute financial advice.