Cardano's ADA extended its decline on Friday, trading below $0.165 and losing over 2% in the past 24 hours. The cryptocurrency remains under sustained bearish pressure as weakening derivatives activity and negative on-chain indicators suggest limited upside in the near term.
Derivatives Data Reflect Growing Bearish Sentiment
Market sentiment for Cardano remains fragile, with derivatives metrics highlighting an increasingly bearish bias among traders. According to CoinGlass, ADA's long-to-short ratio fell to 0.96 on Friday, approaching its lowest level in over a month. A ratio below 1 indicates that short positions outnumber long positions, suggesting most traders are betting on further price declines.

Further reinforcing the negative outlook, Cardano's futures Open Interest (OI) declined to $348 million. While OI saw a modest recovery in mid-June, it has generally trended lower since mid-May. Falling Open Interest typically signals reduced investor participation and weaker conviction, often accompanying bearish market conditions.
On-Chain Metrics Paint a Challenging Picture
On-chain data also paints a challenging picture for Cardano. Santiment data shows that Cardano's Network Realized Profit/Loss (NPL) indicator plunged sharply on Wednesday, indicating that investors were locking in losses rather than profits. Such activity is commonly associated with panic selling and market capitulation, reflecting a deterioration in short-term sentiment.
However, capitulation phases can sometimes signal that selling pressure is nearing exhaustion. A similar pattern emerged during the market downturn in mid-April, when ADA eventually staged a modest recovery after a wave of loss realization subsided. A sustained rebound would still require renewed buying interest to offset the prevailing bearish momentum.
Price Outlook: ADA Remains Below Key Moving Averages
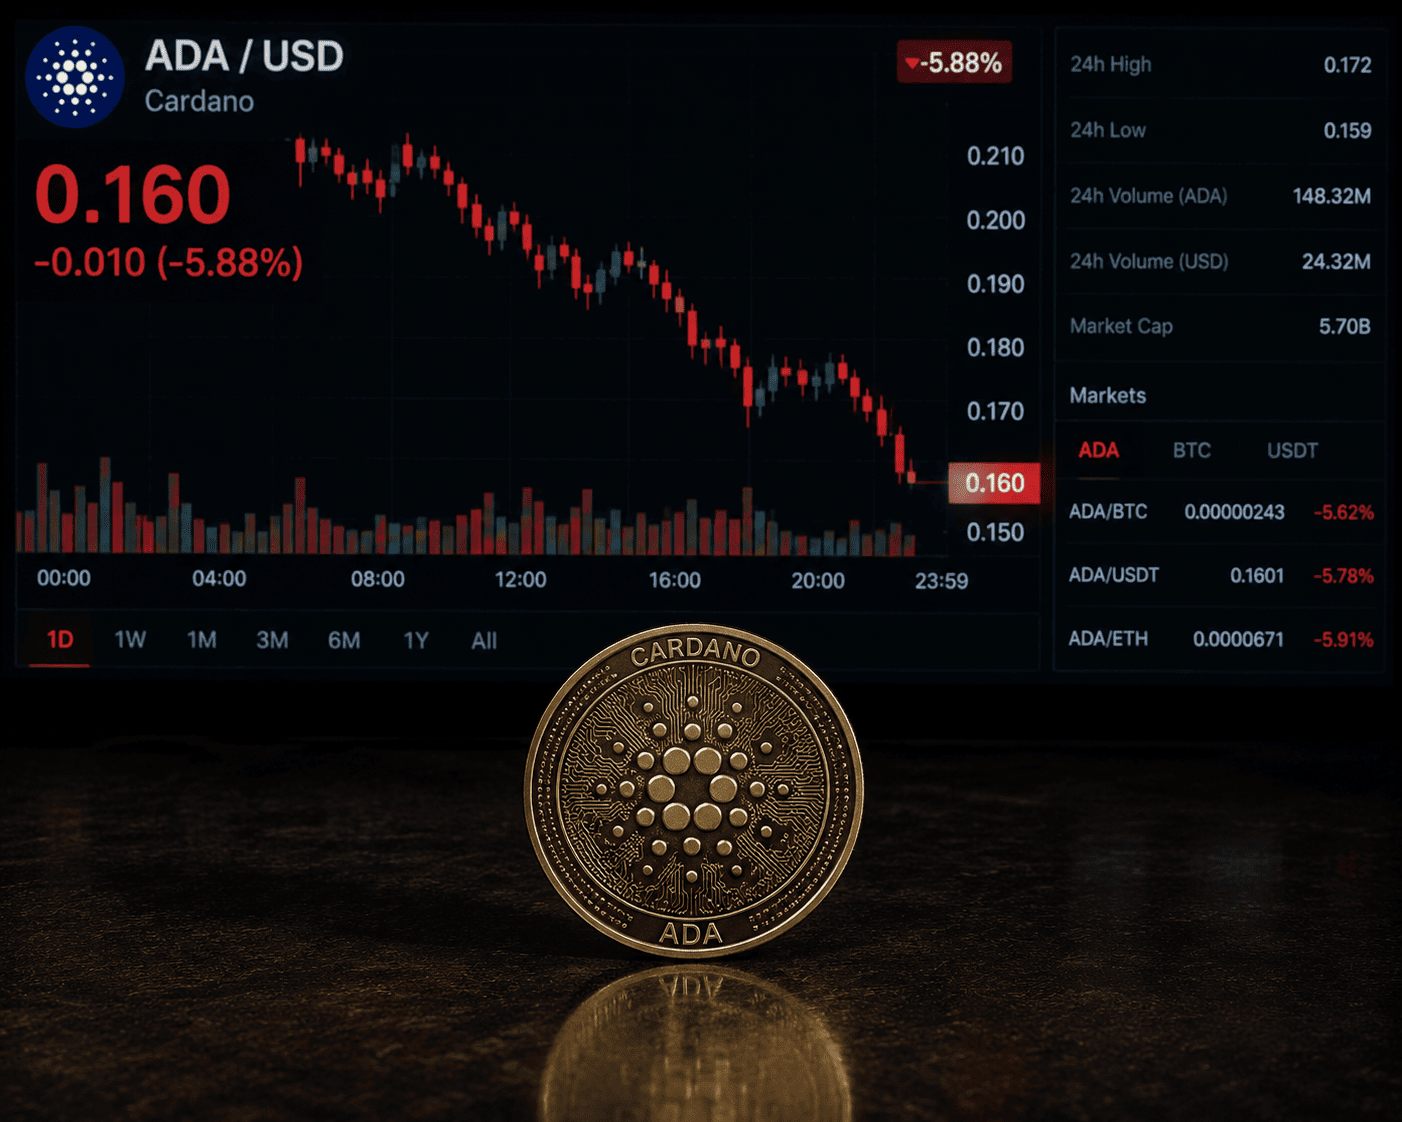
The ADA/USD 4-hour chart remains bearish as Cardano's price action is in a downtrend. ADA is currently trading around $0.160, well below its major moving averages, including the 50-day, 100-day, and 200-day Exponential Moving Averages (EMAs), which are positioned between approximately $0.210 and $0.320.
The Relative Strength Index (RSI) on the 4-hour chart is hovering near 40, just below neutral territory, indicating that bears are still in control. Meanwhile, the Moving Average Convergence Divergence (MACD) indicator has turned slightly positive, which could indicate fading downside momentum but falls short of confirming a bullish shift.
If the bulls regain control and attempt a recovery, the first significant resistance level lies near $0.181. Additional resistance levels are located at $0.202 and the 50-day EMA near $0.210. Beyond these levels, a major resistance zone emerges between $0.218 and $0.245, where several technical barriers converge.
However, if the bearish trend persists, immediate support rests at the June 6 low near $0.148. A decisive break below this level could open the door to deeper losses and push Cardano into fresh bearish territory.
For broader market context, see our analysis on XRP Hovers Above $1.05 as Bearish Pressure Tests Key Support Level and Bitcoin Bounces Above $63K After $60K Defense, But Bearish Signals Persist. Also, check out Cardano Stalls Below $0.170 as Weak Derivatives Signal Limited Upside for related coverage.
This article is for informational purposes only and does not constitute financial advice.