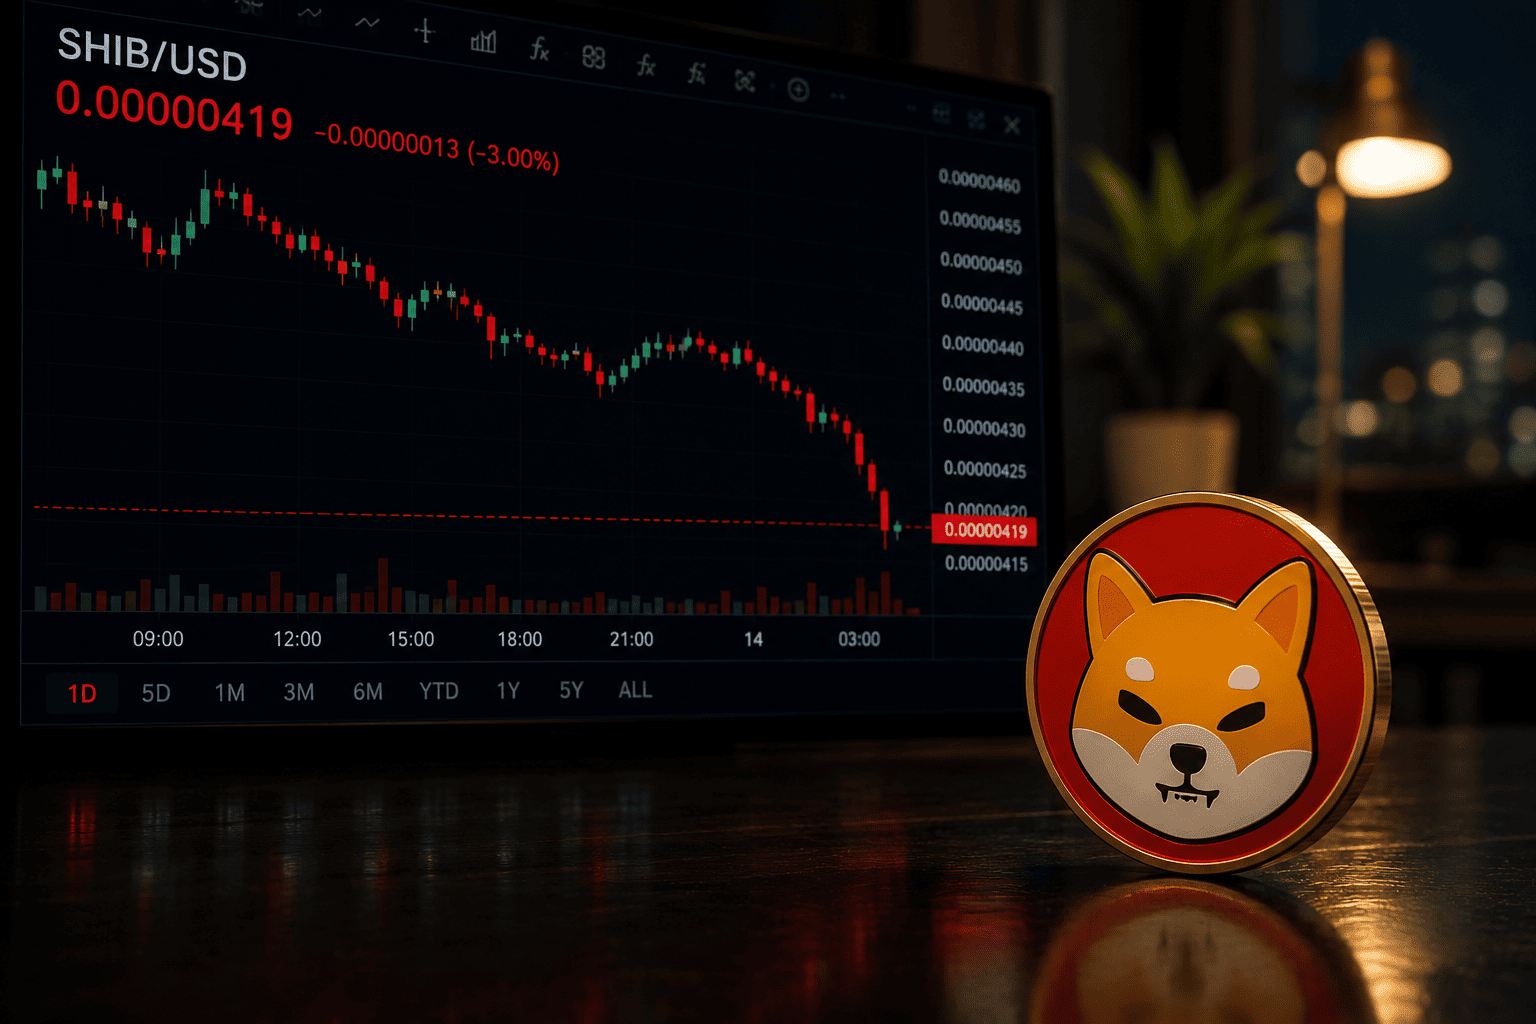
Shiba Inu (SHIB) continued its downward trajectory on Tuesday, marking a fourth consecutive session of losses as a combination of fading investor enthusiasm, bearish derivatives data, and broader macroeconomic uncertainty pressured the meme coin. The token slipped below the $0.0000042 threshold, with market signals suggesting the possibility of further declines toward its yearly low.
On-Chain Metrics Signal Waning Interest
Data from blockchain analytics firm Santiment reveals a notable drop in SHIB's Social Dominance metric, which tracks the token's share of discussions across crypto media and social platforms. After peaking on July 12, the indicator has fallen to 0.014%, approaching levels last seen in early July. This decline in social engagement often correlates with reduced buying pressure, making it harder for the token to sustain any price recoveries.

Futures market data further underscores the bearish sentiment. According to CoinGlass, SHIB's long-to-short ratio now stands at 0.90, near its lowest point in over a month. A ratio below 1 indicates that more traders are betting on price declines than on gains. Additionally, the funding rate remains negative at -0.0136%, meaning short sellers are paying long holders to maintain their positions—a clear sign that bearish positioning dominates the perpetual futures market.
Macro Headwinds Add Pressure
Beyond crypto-specific factors, escalating geopolitical tensions between the United States and Iran have prompted a broader shift away from speculative assets. As one of the most volatile corners of the crypto market, meme coins like SHIB are particularly sensitive to risk-off sentiment. This environment has amplified selling pressure, mirroring moves seen in other risk assets such as SpaceX stock and Bitcoin, which have also slipped amid the uncertainty.
Technical Analysis: Key Support in Focus
The SHIB/USD 4-hour chart paints a bearish picture. The token has been unable to break above a descending trendline that has capped rallies since mid-May, and it has now fallen more than 5% over the past three sessions. The Relative Strength Index (RSI) has dropped to 33, approaching oversold territory, while the Moving Average Convergence Divergence (MACD) is on the verge of a bearish crossover—a signal that could reinforce the downtrend.
Immediate support lies at $0.0000040, the token's yearly low. A break below that level could open the door to further losses. On the upside, SHIB would need to reclaim the descending trendline near $0.0000044 to improve short-term sentiment, though a convincing move would likely require a significant uptick in trading volume.
Outlook: Bearish Bias Dominates
While oversold conditions could eventually spark a short-term bounce, the prevailing data suggests that SHIB's near-term outlook remains weak. Declining social activity, negative derivatives positioning, and cautious investor sentiment all point to continued downside risk. A recovery would require a shift in broader market sentiment and a decisive break above key resistance levels.
This article is for informational purposes only and does not constitute financial advice.