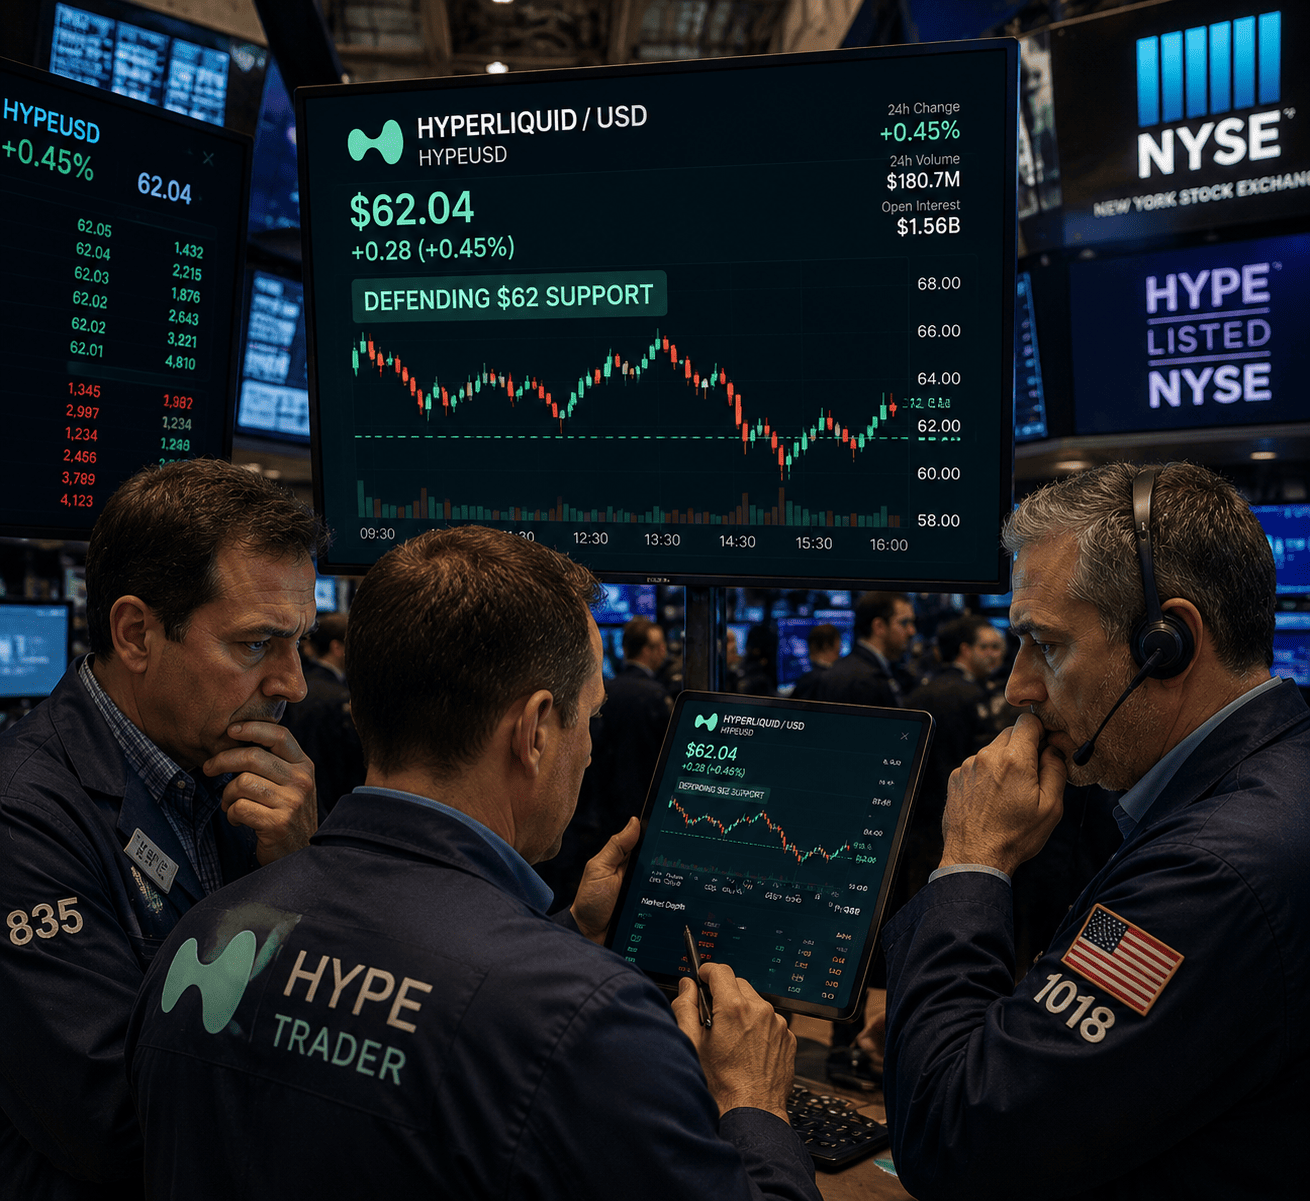
Hyperliquid's native token, HYPE, is testing a critical support zone near $62 after a 15% decline over the past seven days. The level has historically acted as a launchpad for short-term recoveries, and traders are closely monitoring whether buyers can defend it.
Support Confluence Strengthens Bullish Case
The $62 area represents a confluence of several technical indicators on the four-hour chart. The 200-period exponential moving average (EMA) sits near $62.18, while the 0.382 Fibonacci retracement level is around $62.14. Additionally, the lower boundary of a descending channel aligns with this zone, making it a key battleground between bulls and bears.

As long as HYPE remains above this support cluster, the potential for a short-term recovery remains intact. However, a recent death cross—where the 20-period EMA crossed below the 50-period EMA on the four-hour timeframe—has signaled weakening short-term momentum. Historically, such signals have led to brief selloffs followed by strong rebounds once oversold conditions emerge.
Momentum Indicators Point to Consolidation
The Relative Strength Index (RSI) is currently hovering around 34, indicating weakness but not yet oversold territory. In prior corrections, HYPE's RSI fell below 30 before meaningful rebounds developed. This suggests the token may require additional consolidation near $62 before buyers regain enough momentum to push prices higher.
If support holds, HYPE could stage a recovery toward a significant resistance zone between $67 and $68. A decisive break above this range could pave the way for a rally toward $70 to $72, potentially signaling the end of the current pullback and a resumption of the broader uptrend. Traders will likely require confirmation through increased buying volume and sustained momentum before adopting a more aggressive bullish outlook.
Downside Risks Remain
While the short-term setup remains constructive, losing the $62 support zone would invalidate the rebound thesis. A decisive break below the 200-period EMA could expose HYPE to the next major downside target near $57.56. Such a move would likely accelerate selling pressure and shift attention to higher-timeframe support levels.
If sellers manage to push HYPE below $57, the outlook could deteriorate significantly, with the next major support level near $47—the 50-period EMA on the three-day chart. However, a successful defense of $62 would preserve HYPE's broader bullish market structure and potentially create the foundation for the next upward leg.
For context, similar technical patterns have been observed in other assets. For instance, Bloom Energy Stock Down 33%: Technical Pattern Hints at Rebound Ahead of Q2 Earnings highlights how support levels can precede recoveries. Meanwhile, SoFi Stock Rebounds 27% from Lows: Can Q2 Earnings Sustain the Rally? demonstrates the importance of volume and momentum in sustaining rebounds.
This article is for informational purposes only and does not constitute financial advice.

