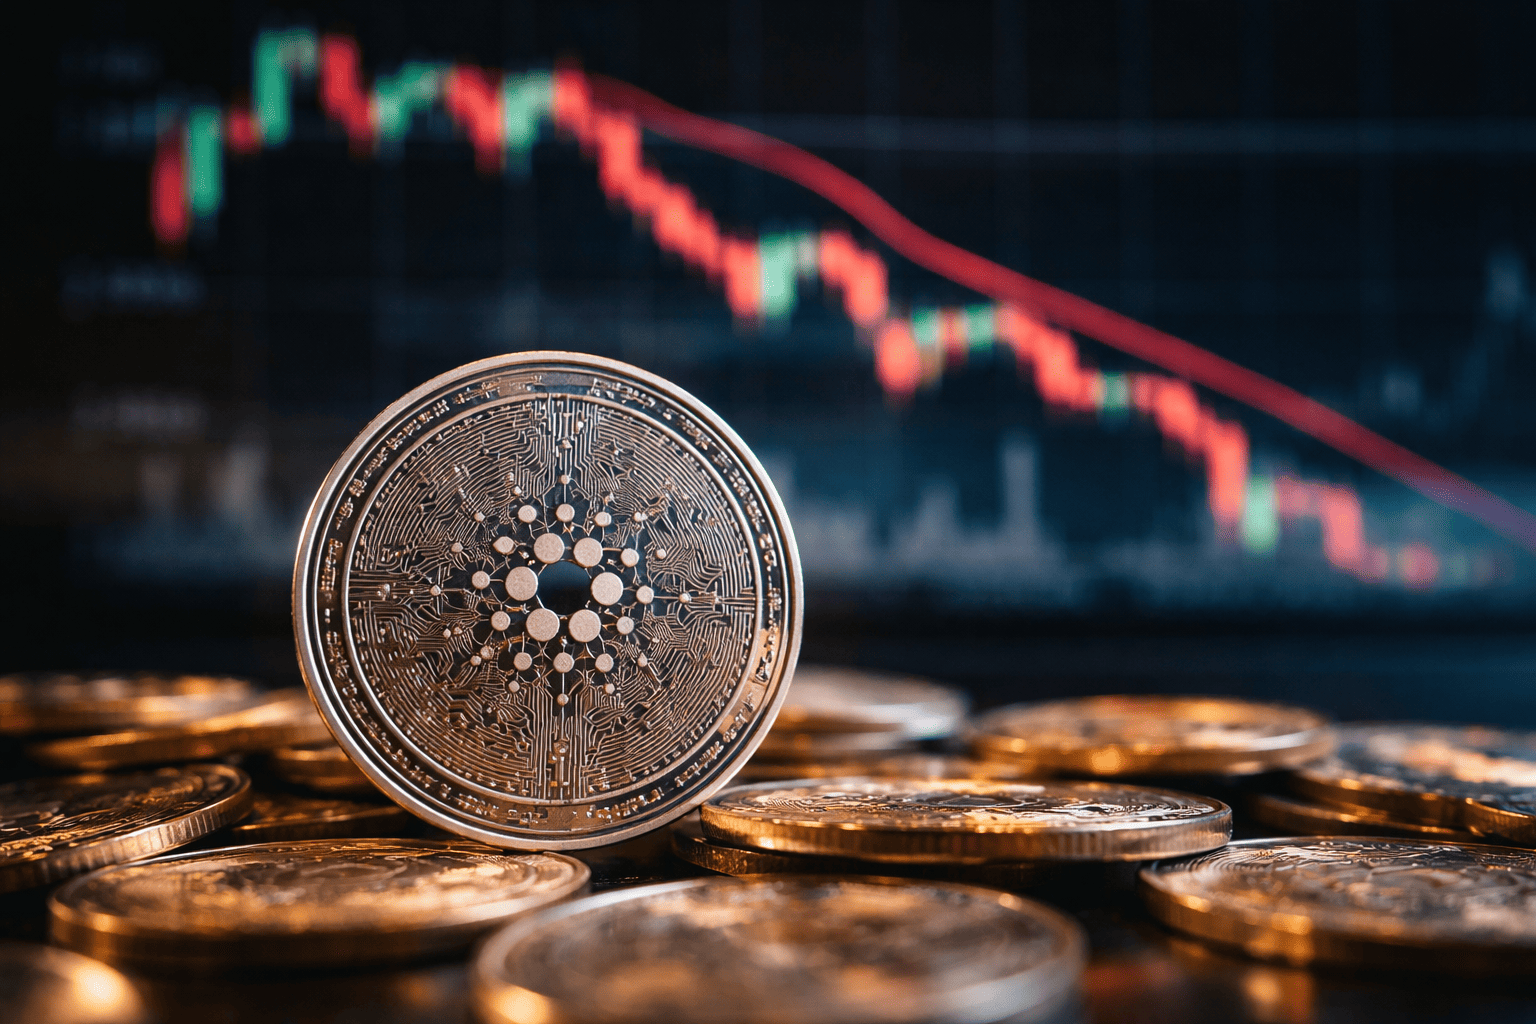
Ethereum is holding near the $1,700 support level as rising exchange inflows and declining derivatives activity test the resolve of bulls. The cryptocurrency has lost roughly 30% over the past six weeks, with the current price zone emerging as a critical battleground for market participants.
Exchange Inflows Add Supply Pressure
According to CryptoQuant analyst Pelin Ay, Binance has recorded net inflows of approximately 57,700 ETH in recent days, adding fresh supply to the market at a time when demand remains subdued. Only about 320 new addresses have deposited ETH during this period, a figure that lags participation levels seen in previous buying waves. Large transfers to exchanges often precede selling activity, and Binance, as a major source of spot liquidity, has become a focal point for traders assessing downside risk.
On-chain data also shows a sharp rise in Ethereum's "Age Consumed" metric, indicating that older, previously inactive coins have been moved. A portion of these transfers occurred at realized losses, suggesting some long-term holders exited during the downturn. Despite these inflows, daily ETH issuance remains restrained at roughly 2,791 ETH, low compared with historical levels before the EIP-1559 upgrade.
Derivatives Activity Contracts
Futures open interest has declined to $10.3 billion from approximately $15 billion a month ago, a drop of about 31%, according to Ay. Aggregate open interest has fallen to its lowest level since April 2025. The estimated leverage ratio dropped to 0.83 after reaching an all-time high of 1.10 on June 2, marking one of the largest leverage reductions since late 2025. Such moves typically indicate traders are less willing to take aggressive directional bets, removing a source of buying power that previously supported rebounds.
The reduction in leverage followed a period of vulnerability. As ETH slipped below the $1,800 level, long positions accumulated around that area were liquidated, adding selling pressure and accelerating the decline toward the mid-$1,600 range. Institutional flows have offered little support, with US spot Ethereum ETFs experiencing a prolonged 17-day streak of net outflows. Although the pace of withdrawals has slowed, market depth remains weaker than earlier this year.
Macro Headwinds and Weaker Fundamentals
Higher-for-longer interest rate expectations, persistent strength in the US dollar, and risk-off sentiment across financial markets have reduced appetite for speculative assets. Ethereum has also faced weaker decentralized finance activity, lower lending volumes, and declining decentralized exchange activity, while the ETH/BTC pair continues to trend lower. These factors compound the pressure on the $1,700 support level.
Technical Analysis Points to Critical Support Test
Ethereum's price structure places attention on the $1,700 area. The asset remains close to a demand zone identified by analysts between $1,700 and $1,400. The April 2025 low at $1,384 is the nearest major downside liquidity target if support fails. On the daily chart, the visible range volume profile shows significant trading clusters around current prices, suggesting substantial historical activity that often strengthens support.
The daily RSI has recovered to around 37 after falling below 20 during the selloff, crossing above its moving average and signaling that downside momentum has eased. Crypto analyst Ardi notes that ETH recently tested the lower edge of a long-term acceptance range that has historically aligned with major cycle lows. The weekly RSI near 31 and a daily RSI record low of 11 during the selloff could support a bottoming process. However, the daily RSI remains below the neutral 50 level, and price continues to trade beneath a sequence of lower highs established since late 2025.
Volume profile data identifies a major overhead supply zone between roughly $2,400 and $2,600. Any sustained recovery would likely need to overcome that region before a larger trend reversal can develop. For now, analysts view the $1,400 to $1,700 range as the market's key battleground. Holding above that area could strengthen the case for a prolonged accumulation phase, while a decisive break lower would place the April low near $1,384 back into focus, followed by a longer-term demand region between $1,289 and $1,071 dating back to early 2023.
For context on broader market dynamics, see XRP Faces $1.05 Support Test as Bearish Signals Outweigh $2.4M ETF Inflows and Ethereum's 5-Year Stagnation Sparks Debate: Analysts Eye $4,630 Recovery Target.
This article is for informational purposes only and does not constitute financial advice.