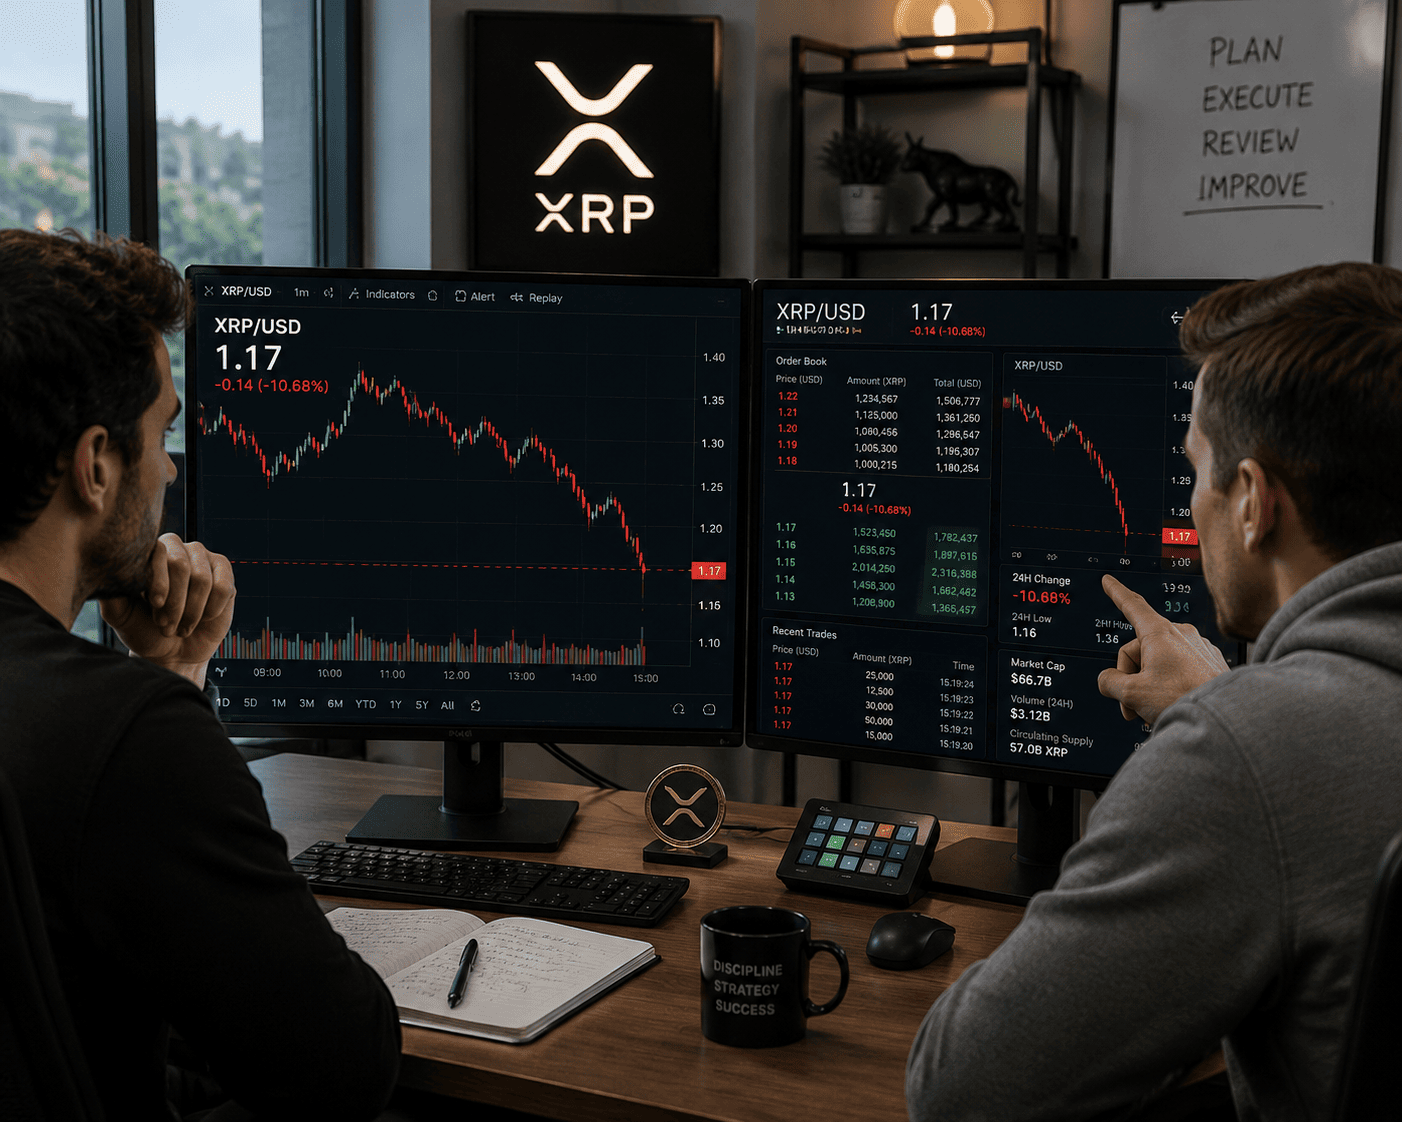
Ripple's XRP is trading around $1.17 on Thursday, down more than 3% in the last 24 hours, as the cryptocurrency faces a tug-of-war between weak technical signals and growing adoption of the RLUSD stablecoin. The token remains below the upper boundary of its falling channel after failing to break through higher resistance levels.
Derivatives Data Points to Bearish Sentiment
Market positioning data from CoinGlass reveals a mildly bearish outlook for XRP. The OI-weighted funding rate has turned negative at -0.0090%, indicating that short positions are paying longs—a classic sign of bearish sentiment. Additionally, the long-to-short ratio has dipped to 0.9369, reinforcing cautious trader positioning. Futures open interest has also declined to $2.7 billion from $2.8 billion on Wednesday, suggesting reduced speculative appetite.
Despite these bearish signals, institutional inflows into spot XRP ETFs could provide a floor. According to CoinGlass, ETF inflows were muted on Wednesday but totaled 4.28 million XRP on Tuesday and 2.38 million XRP on Monday. For context, earlier this month, XRP saw $10.6 million in ETF inflows despite a price dip to $1.13, highlighting persistent institutional interest.
RLUSD Adoption Accelerates
Ripple is actively expanding the use of its RLUSD stablecoin. This week, the company invested in Flutterwave's $3.2 billion Series E round to integrate RLUSD and XRP Ledger technology into cross-border payments across Africa. Flutterwave will incorporate RLUSD into its payments infrastructure, enabling businesses to settle international transactions using digital dollars.
Additionally, cross-chain infrastructure platform Squid has integrated RLUSD, allowing users to swap into and out of the stablecoin across more than 100 blockchains and over 20,000 digital assets in a single transaction. These developments, combined with continued ETF inflows, could support XRP's price in the near to medium term.
Technical Outlook: Cautious but Stabilizing
On the 4-hour chart, XRP remains below its 50-day, 100-day, and 200-day exponential moving averages (EMAs) at approximately $1.28, $1.37, and $1.58. However, momentum indicators show early stabilization: the Relative Strength Index (RSI) is near 54, and the MACD lines are trending slightly higher. These signals suggest a corrective move within a broader downtrend rather than a reversal.
If bullish momentum resumes, immediate resistance lies between $1.24 and $1.30, aligning with key moving averages. A daily close above this zone could open the path toward $1.37 and $1.58. Conversely, failure to reclaim these levels may expose XRP to renewed downside. The first major support sits at $1.1258, with a break below potentially leading to a retest of the June 6 swing low of $1.05. For more on XRP's support levels, see our analysis on XRP facing a $1.05 support test.
In the broader market context, XRP's price action mirrors the cautious tone seen in other assets. For instance, Bitcoin Cash recently reclaimed $200 but faces similar technical headwinds, underscoring the challenging environment for cryptocurrencies.
This article is for informational purposes only and does not constitute financial advice.