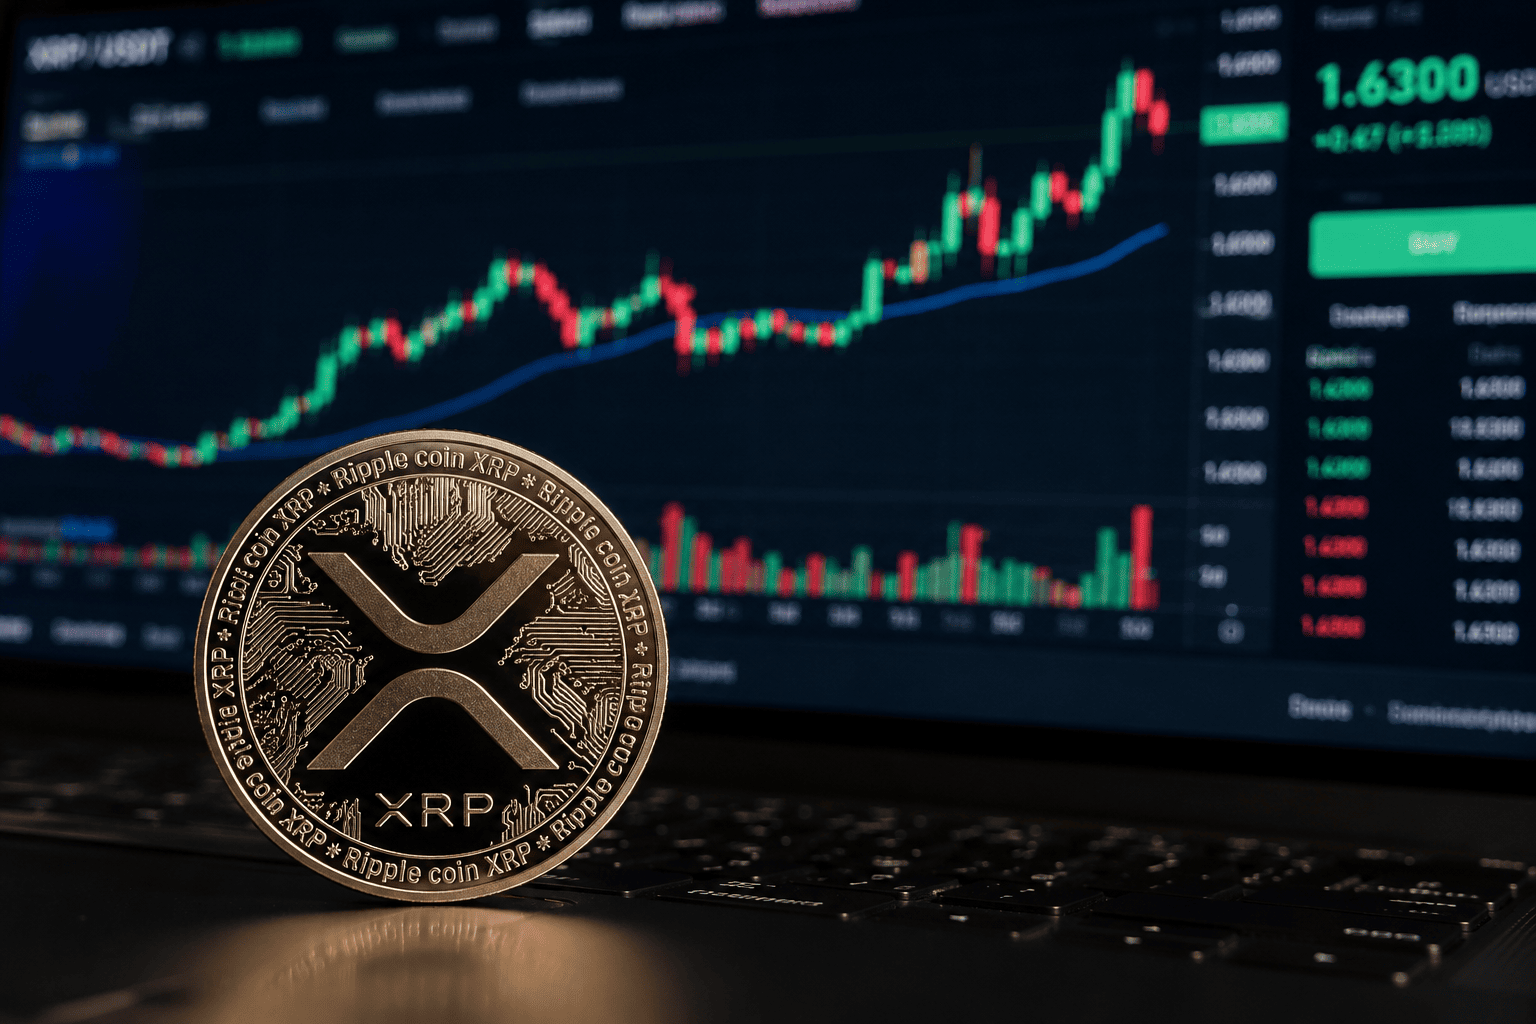
XRP has managed to maintain its position above the psychologically important $1 level, even as the token faces persistent selling pressure and a 19% decline over the past month. The digital asset is currently trading around $1.05, according to CoinGecko, after slipping more than 7% in the last week. Its market capitalization stands at roughly $65.4 billion, with daily trading volume exceeding $1.1 billion.
Despite the recent weakness, XRP continues to attract institutional capital. Spot XRP ETFs have recorded net inflows for seven consecutive weeks, accumulating approximately $144.7 million over that period, per SoSoValue data. On June 26 alone, these funds drew about $15.6 million, leading all cryptocurrency ETFs for the day. This stands in stark contrast to the broader market, where spot Bitcoin ETFs saw $444.5 million in net outflows and Ethereum funds lost $12.9 million on the same day. Over the same seven-week stretch, Bitcoin ETFs have shed roughly $7.7 billion, while Ethereum ETFs have seen $1.2 billion in outflows.

Network activity has also picked up. Crypto analyst Ali Charts noted that daily active XRP addresses rose from around 23,000 on June 14 to nearly 39,500 two weeks later. Higher active address counts typically indicate increased user engagement with the blockchain, though this does not guarantee a price recovery.
Technically, XRP remains under pressure. The token continues to trade below its 20-, 50-, 100-, and 200-day exponential moving averages (EMAs), confirming that sellers control the broader trend. On the daily chart, XRP is hovering near the 100% Fibonacci retracement level around $1.05 after declining from a recent swing high. Immediate resistance sits at $1.10, followed by the 61.8% Fibonacci retracement near $1.14 and the 50% retracement around $1.17. The 50-day EMA near $1.20 and the 100-day EMA around $1.31 form a higher resistance zone that bulls would need to reclaim to shift sentiment.
The 4-hour chart shows XRP consolidating between roughly $1.03 and $1.06 after several sessions of sideways trading. Volume Profile Visible Range data identifies the $1.13 to $1.15 area as a high-volume node, making it a significant resistance level. The 4-hour relative strength index (RSI) has recovered to around 46 after nearing oversold territory, indicating that selling pressure has eased, though momentum remains below the neutral 50 mark.
Derivatives markets have also undergone a notable shift. According to CryptoQuant, XRP futures experienced a broad deleveraging phase after long liquidations surged to nearly $3 million—an increase of more than 800% compared with the previous month. Open interest fell from about $1.2 billion to roughly $1 billion, while funding rates turned sharply negative as leveraged bullish positions were forced out. Such conditions often remove excessive leverage before the market establishes its next directional move, though a reversal is not guaranteed. Spot market behavior has remained relatively stable, with Binance reserve balances showing little change, suggesting holders are not rushing to sell.
For now, the $1 level remains the key support to watch. Holding above it could allow XRP to challenge resistance between $1.10 and $1.15 before testing the broader resistance cluster around $1.20 to $1.31. A sustained break below $1, however, would expose the next technical support near $0.90, with $0.85 and $0.70 as additional downside levels if selling pressure accelerates.
For more on related market dynamics, see our coverage on Chainlink Nears $8 as Institutional ETF Inflows Signal Renewed Investor Confidence and XRP Holds Above $1.10 as Bulls Eye $1.17 Resistance Amid Mixed Sentiment.
This article is for informational purposes only and does not constitute financial advice.

