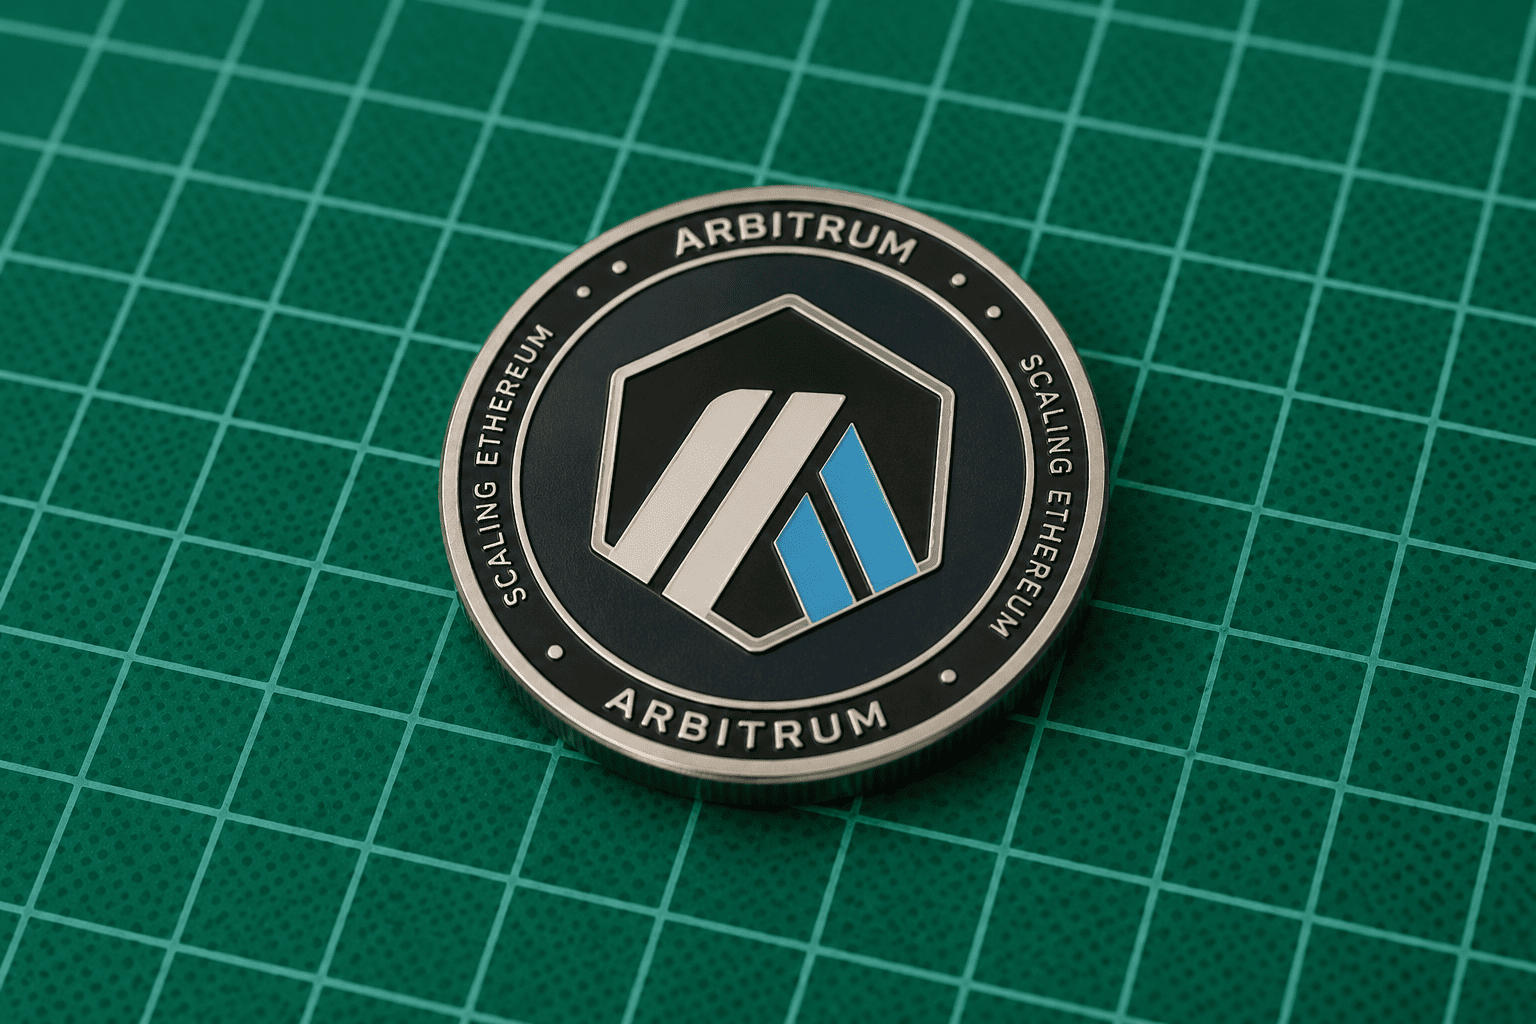
Arbitrum's native token, ARB, experienced a sharp rally of over 10% following news that LG Electronics is developing a blockchain-powered advertising network on the Ethereum layer-2 protocol. According to CoinGecko, ARB traded around $0.083 on June 12 after reaching intraday highs near $0.0845.
Why ARB Is Gaining
The price surge came after reports that LG is expanding its blockchain initiatives through a dedicated layer-2 blockchain for digital advertising, built on Arbitrum. As reported by Fortune, the South Korean tech giant has partnered with Arbitrum to create a shared database where advertisers and publishers can access inventory and track user interactions across campaigns. Commercial deployment is expected later this year following a pilot program with an unnamed Japanese advertising agency.

Samuel Byungsun Park, head of LG's blockchain research department, stated that the company is evaluating whether the model can deliver practical value for all participants in the ecosystem. This enterprise adoption adds to a growing list of institutional use cases on Arbitrum.
Earlier this year, AmericanFortress launched a beta privacy infrastructure on Arbitrum aimed at institutional users and large DeFi participants. The system generates one-time stealth addresses between counterparties, keeping transaction activity hidden from outside observers while allowing involved parties to access records.
ARB also gained attention after being included in Fortune's inaugural Crypto 100 list. Broader market sentiment improved after US President Donald Trump indicated that a US-Iran peace agreement is close to finalization, which helped Bitcoin reclaim the $63,000 level and lifted sentiment across major cryptocurrencies. However, Iranian state media later denied any such agreement.
Technical Analysis: Double Bottom Pattern
On the 4-hour chart, ARB appears to be forming a bullish reversal pattern after weeks of decline from the $0.12 region. A double bottom formation is developing, with the first low near $0.076 on June 5-6 and a second test of the same support area around June 10-11. The second low formed slightly higher, suggesting weakening selling pressure.
The token has since recovered toward the neckline resistance near $0.0841, which represents the highest point between the two bottoms. For the pattern to be confirmed, ARB needs a clear 4-hour candle close above this level. If successful, the measured move projects a potential advance toward roughly $0.092.
The 20-period exponential moving average (EMA) sits near $0.0815 and has already been reclaimed. The 50-period EMA is around $0.0843, nearly identical to the double-bottom neckline, making the $0.0841–$0.0843 zone a major technical barrier. A breakout above that region would place the next focus on the 100-period EMA near $0.091, which aligns with the projected target. The 200-period EMA remains near $0.1004, and as long as ARB stays below that level, the broader 4-hour trend still favors sellers.
The relative strength index (RSI) has recovered from oversold conditions and now sits above the neutral 50 mark, indicating momentum has shifted back to buyers without entering overbought territory. This suggests bullish momentum is building, but confirmation depends on whether ARB can convert the $0.0841–$0.0843 resistance zone into support.
For context, similar technical setups have been observed in other assets. For instance, XRP Open Interest Hits $2.4B as Bulls Target $1.155 Resistance and Ethereum Holds Above $1,900 as Staking Revenue Surges; Key Resistance at $1,950 highlight how key resistance levels often determine near-term direction.
If ARB fails to break through, it may continue trading within its recent range, delaying any larger reversal attempt. A successful breakout, however, could open the path toward $0.091–$0.092, with the next major hurdle at the 200-period EMA near $0.1004.
This article is for informational purposes only and does not constitute financial advice.